使用 PyTorch Profiler 对 Ray Train 工作负载进行性能分析#
完成时间: 15 分钟
此模板使用 PyTorch Profiler 对 PyTorch 训练代码进行性能分析,以识别性能瓶颈、优化内存使用并监控分布式环境中的训练效率。
在本教程中,您将
从一个基本的单机 PyTorch 示例开始,学习性能分析基础知识。
使用 Ray Train 将其分发到多台机器上的多个 GPU,并对分布式训练工作负载进行性能分析。
探索高级性能分析技术,包括内存分析、性能分析和仪表板集成,以实现全面的监控。
通过 Ray Train,您可以跨多个工作节点对分布式训练工作负载进行性能分析,从而识别对优化大规模训练作业至关重要的通信瓶颈、负载均衡问题和资源利用率模式。
Anyscale 特定配置
注意:本教程已针对 Anyscale 平台进行了优化。在开源 Ray 上运行时,需要额外的配置。例如,您需要手动
- 配置您的 Ray 集群:设置您的多节点环境并管理资源分配,而无需 Anyscale 的自动化。
- 管理依赖项:在每个节点上手动安装和管理依赖项。
- 设置存储:配置您自己的分布式或共享存储系统以进行模型检查点。
%%bash
pip install torch torchvision matplotlib
使用 Ray Train 和 PyTorch Profiler 进行分布式训练#
此示例演示了如何使用 PyTorch Profiler 运行 Ray Train 进行 PyTorch 训练。本节使用一个简单的 ResNet 模型来演示如何结合使用 Pytorch Profiler 和 Ray Train 来分析模型性能。
通过 Ray Train,您可以跨多个工作节点对分布式训练工作负载进行性能分析,从而识别对优化大规模训练作业至关重要的通信瓶颈、负载均衡问题和资源利用率模式。
首先,设置一些环境变量并导入 Ray Train 模块。
# Enable Ray Train V2 for the latest train API.
# V2 will be the default in an upcoming release.
import os
os.environ["RAY_TRAIN_V2_ENABLED"] = "1"

# Ray Train imports
import ray.train
import ray.train.torch
from ray.train import RunConfig, ScalingConfig
from ray.train.torch import TorchTrainer

# PyTorch imports
import torch
import torch.nn as nn
from torch.utils.data import DataLoader
from torchvision.datasets import FashionMNIST
from torchvision.models import resnet18
from torch.optim import Adam
from torch.nn import CrossEntropyLoss
from torchvision.transforms import Compose, ToTensor, Normalize

# Utility imports
import tempfile
import uuid
接下来,创建一个分布式训练函数供 Ray Train 启动。下面训练函数中的每个编号注释都表示使用 Ray Train 和 Pytorch Profiler 进行分布式训练和性能分析所需的步骤。
本教程使用集群存储以实现快速迭代和开发,但这可能不适用于生产环境或大规模部署。在这些情况下,您应该使用对象存储。有关如何选择存储类型的更多信息,请参阅 Anyscale 存储配置文档。脚本的输出可在 Anyscale 工作区的“Files”选项卡中找到。对于未使用 Anyscale 平台的开发人员,您可以在 RunConfig 和 Profiler 中指定的配置位置查看日志和性能分析输出。
# Configure storage path for profiling outputs and training results.
# This path serves two purposes:
# 1. Ray Train RunConfig uses it as the base location for experiment artifacts,
#    checkpoints, and logs (set via RunConfig's storage_path parameter).
# 2. PyTorch Profiler writes TensorBoard traces and memory profiles here
#    (used in tensorboard_trace_handler and export_memory_timeline calls).
# All profiling results and training artifacts will be stored under this path.
storage_path = "/mnt/cluster_storage/"
def train_func_distributed():
    """Distributed training function with enhanced profiling for Ray Train."""

    # Model, loss, optimizer
    model = resnet18(num_classes=10)
    model.conv1 = torch.nn.Conv2d(
        1, 64, kernel_size=(7, 7), stride=(2, 2), padding=(3, 3), bias=False
    )

    # [1] Prepare model for distributed training.
    # The prepare_model method wraps the model with DistributedDataParallel
    # and moves it to the correct GPU device.
    # ================================================================
    model = ray.train.torch.prepare_model(model)

    criterion = CrossEntropyLoss()
    optimizer = Adam(model.parameters(), lr=0.001)

    # Data
    transform = Compose([ToTensor(), Normalize((0.28604,), (0.32025,))])
    data_dir = os.path.join(tempfile.gettempdir(), "data")
    train_data = FashionMNIST(root=data_dir, train=True, download=True, transform=transform)
    train_loader = DataLoader(train_data, batch_size=128, shuffle=True)

    # [2] Prepare dataloader for distributed training.
    # The prepare_data_loader method assigns unique rows of data to each worker
    # and handles distributed sampling.
    # ========================================================================
    train_loader = ray.train.torch.prepare_data_loader(train_loader)

    world_rank = ray.train.get_context().get_world_rank()
    world_size = ray.train.get_context().get_world_size()

    # [3] Configure enhanced profiling for distributed training.
    # This includes TensorBoard integration and memory timeline export
    # for comprehensive performance analysis across workers.
    # See more details at https://docs.pytorch.ac.cn/docs/stable/profiler.html
    # =============================================================
    activities = [torch.profiler.ProfilerActivity.CPU, torch.profiler.ProfilerActivity.CUDA]

    with torch.profiler.profile(
        activities=activities,
        schedule=torch.profiler.schedule(wait=1, warmup=1, active=3, repeat=1),
        on_trace_ready=torch.profiler.tensorboard_trace_handler(f'{storage_path}/logs/distributed'),
        record_shapes=True,
        profile_memory=True,
        with_stack=True,
    ) as prof:

        # Training loop
        for epoch in range(10):
            # [4] Set epoch for distributed sampler to ensure proper shuffling
            # across all workers in each epoch.
            # ==============================================================
            if world_size > 1:
                train_loader.sampler.set_epoch(epoch)

            for batch_idx, (images, labels) in enumerate(train_loader):
                outputs = model(images)
                loss = criterion(outputs, labels)
                optimizer.zero_grad()
                loss.backward()
                optimizer.step()
                prof.step()

                # Log performance metrics every 50 batches
                if batch_idx % 50 == 0 and world_rank == 0:
                    print(f"Epoch {epoch}, Batch {batch_idx}, Loss: {loss.item():.4f}")

            # [5] Report metrics and checkpoint.
            # Each worker reports its metrics and saves checkpoints to shared storage.
            # ====================================================================
            metrics = {"loss": loss.item(), "epoch": epoch}
            with tempfile.TemporaryDirectory() as temp_checkpoint_dir:
                torch.save(
                    model.state_dict(),
                    os.path.join(temp_checkpoint_dir, "model.pt")
                )
                ray.train.report(
                    metrics,
                    checkpoint=ray.train.Checkpoint.from_directory(temp_checkpoint_dir),
                )

            # Log metrics from rank 0 only to avoid duplicate outputs
            if world_rank == 0:
                print(f"Epoch {epoch}, Loss: {loss.item():.4f}")

    # [6] Export memory timeline for each worker.
    # This creates separate memory profiles for each worker to analyze
    # memory usage patterns across the distributed training job.
    # ==============================================================
    run_name = ray.train.get_context().get_experiment_name()
    prof.export_memory_timeline(
        f"{storage_path}/{run_name}/rank{world_rank}_memory_profile.html"
    )

    if world_rank == 0:
        print(f"Distributed profiling complete! Check '/mnt/cluster_storage/{run_name}/' for worker-specific memory profiles.")
        print("Files generated:")
        print(f"  - rank{world_rank}_memory_profile.html (Memory analysis)")
        print(f"  - rank{world_rank}_chrome_trace.json (Chrome trace)")
        print("  - TensorBoard logs in /mnt/cluster_storage/logs/distributed/")
最后,使用 Ray Train 运行分布式训练函数。TorchTrainer 协调跨多个工作节点的分布式训练作业,每个节点运行启用性能分析的训练函数。
# Configure scaling and resource requirements for distributed training
scaling_config = ray.train.ScalingConfig(num_workers=2, use_gpu=True)

# Create a unique experiment name for this profiling run
experiment_name = f"profiling_run_{uuid.uuid4().hex[:8]}"

# Configure run settings with persistent storage for profiling outputs.
# The storage_path parameter tells Ray Train where to store experiment artifacts,
# checkpoints, and logs. This is also the same path where PyTorch Profiler outputs
# (TensorBoard traces and memory profiles) are written to, allowing you to access
# all training and profiling results from a single location.
run_config = ray.train.RunConfig(
    storage_path=storage_path,
    name=experiment_name,
)

# Launch distributed training job with profiling
trainer = ray.train.torch.TorchTrainer(
    train_func_distributed,
    scaling_config=scaling_config,
    run_config=run_config,
)

print(f"Starting distributed training with profiling: {experiment_name}")
result = trainer.fit()
print(f"Distributed training with profiling completed successfully! Results are: {result}")
print(f"Check '{storage_path}/{experiment_name}/' for profiling results.")
高级性能分析技术和仪表板集成#
本节探讨高级性能分析技术,包括自定义性能分析计划、性能分析和与 Ray Train 监控功能的集成。这些技术可帮助您更深入地了解训练工作负载的性能并识别优化机会。
自定义性能分析计划和性能分析#
PyTorch Profiler 提供灵活的调度选项来捕获训练的不同阶段。您可以配置何时进行性能分析,以专注于训练循环中的特定操作或阶段。
以下代码部分使用 torch.profile.record_function 来修改之前的训练函数,以记录一些特定操作。
def train_func_advanced_profiling():
    """Advanced profiling example with custom schedules and performance analysis."""

    # Model setup
    model = resnet18(num_classes=10)
    model.conv1 = torch.nn.Conv2d(
        1, 64, kernel_size=(7, 7), stride=(2, 2), padding=(3, 3), bias=False
    )
    model = ray.train.torch.prepare_model(model)

    criterion = CrossEntropyLoss()
    optimizer = Adam(model.parameters(), lr=0.001)

    # Data setup
    transform = Compose([ToTensor(), Normalize((0.28604,), (0.32025,))])
    data_dir = os.path.join(tempfile.gettempdir(), "data")
    train_data = FashionMNIST(root=data_dir, train=True, download=True, transform=transform)
    train_loader = DataLoader(train_data, batch_size=128, shuffle=True)
    train_loader = ray.train.torch.prepare_data_loader(train_loader)

    world_rank = ray.train.get_context().get_world_rank()

    # [1] Advanced profiling configuration with custom schedule.
    # This schedule profiles every 2nd step to reduce overhead while
    # still capturing representative performance data.
    # ==============================================================
    activities = [torch.profiler.ProfilerActivity.CPU, torch.profiler.ProfilerActivity.CUDA]

    # Custom schedule: wait=1, warmup=1, active=3, repeat=1
    # This means the profiler skips 1 step, then warmups for 1 step, then does the active profiling for 3 steps, then repeats.
    # See more details at https://docs.pytorch.ac.cn/docs/stable/profiler.html#torch.profiler.schedule
    schedule = torch.profiler.schedule(wait=1, warmup=1, active=3, repeat=1)

    with torch.profiler.profile(
        activities=activities,
        schedule=schedule,
        on_trace_ready=torch.profiler.tensorboard_trace_handler(f'{storage_path}/logs/advanced'),
        record_shapes=True,
        profile_memory=True,
        with_stack=True,
        # [2] Enable experimental Kineto library features for enhanced analysis.
        # Kineto is a library that provides performance observability and diagnostic to deprecate TensorBoard.
        # See more details at https://github.com/pytorch/kineto.
        # ======================================================
        experimental_config=torch.profiler._ExperimentalConfig(verbose=True),
    ) as prof:

        # Training loop with performance monitoring
        for epoch in range(10):
            if ray.train.get_context().get_world_size() > 1:
                train_loader.sampler.set_epoch(epoch)

            epoch_start_time = torch.cuda.Event(enable_timing=True)
            epoch_end_time = torch.cuda.Event(enable_timing=True)

            epoch_start_time.record()

            for batch_idx, (images, labels) in enumerate(train_loader):
                # [3] Profile individual operations for detailed analysis.
                # ========================================================
                with torch.profiler.record_function("forward_pass"):
                    outputs = model(images)

                with torch.profiler.record_function("loss_computation"):
                    loss = criterion(outputs, labels)

                with torch.profiler.record_function("backward_pass"):
                    optimizer.zero_grad()
                    loss.backward()
                    optimizer.step()

                prof.step()

                # Log performance metrics every 50 batches
                if batch_idx % 50 == 0 and world_rank == 0:
                    print(f"Epoch {epoch}, Batch {batch_idx}, Loss: {loss.item():.4f}")

            epoch_end_time.record()
            # Wait for GPU operations to complete since CUDA operations are asynchronous.
            torch.cuda.synchronize()

            # [4] Calculate and report timing metrics.
            # ======================================
            epoch_time = epoch_start_time.elapsed_time(epoch_end_time)
            metrics = {
                "loss": loss.item(),
                "epoch": epoch,
                "epoch_time_ms": epoch_time,
                "profiler_step": prof.step_num
            }

            with tempfile.TemporaryDirectory() as temp_checkpoint_dir:
                torch.save(
                    model.state_dict(),
                    os.path.join(temp_checkpoint_dir, "model.pt")
                )
                ray.train.report(
                    metrics,
                    checkpoint=ray.train.Checkpoint.from_directory(temp_checkpoint_dir),
                )

            if world_rank == 0:
                print(f"Epoch {epoch} completed in {epoch_time:.2f}ms")

    # [5] Export comprehensive profiling data.
    # ======================================
    run_name = ray.train.get_context().get_experiment_name()

    # Export memory timeline
    prof.export_memory_timeline(
        f"{storage_path}/{run_name}/rank{world_rank}_advanced_memory_profile.html"
    )


    if world_rank == 0:
        print(f"Advanced profiling complete! Check '{storage_path}/{run_name}/' for detailed profiling results.")
        print("Files generated:")
        print(f"  - rank{world_rank}_advanced_memory_profile.html (Memory analysis)")
        print(f"  - rank{world_rank}_chrome_trace.json (Chrome trace)")
        print(f"  - TensorBoard logs in '{storage_path}/logs/advanced/'")
类似前一步骤,启动 Ray Train 作业。
# Run the advanced profiling example
scaling_config = ray.train.ScalingConfig(num_workers=2, use_gpu=True)

# Create a unique experiment name for advanced profiling
advanced_experiment_name = f"advanced_profiling_{uuid.uuid4().hex[:8]}"

# Configure run settings with storage_path for both Ray Train artifacts and profiler output
run_config = ray.train.RunConfig(
    storage_path=storage_path,
    name=advanced_experiment_name,
)

# Launch advanced profiling training job
trainer = ray.train.torch.TorchTrainer(
    train_func_advanced_profiling,
    scaling_config=scaling_config,
    run_config=run_config,
)

print(f"Starting advanced profiling training: {advanced_experiment_name}")
result = trainer.fit()
print(f"Advanced profiling training completed successfully! Results are: {result}")
print(f"Check '{storage_path}/{advanced_experiment_name}/' for comprehensive profiling results.")
分析性能分析结果#
运行性能分析示例后,您可以访问多种类型的性能分析数据
TensorBoard 跟踪:位于
/mnt/cluster_storage/logs/或您配置的持久存储中。使用这些跟踪来可视化 GPU/CPU 利用率、内核执行时间和内存分配模式。内存时间线 HTML 文件:工作节点特定的内存配置文件,显示一段时间内的内存使用情况,有助于识别内存泄漏和优化机会。
Ray Train 仪表板:如果使用 Anyscale 工作区,请访问 Ray Train 仪表板以监控实时指标、工作节点状态和资源利用率。
需要关注的关键性能分析洞察:#
GPU 利用率:确保您的工作负载高效利用 GPU(高利用率百分比)
内存使用模式:查找内存峰值、泄漏或低效的分配模式
通信开销:监控梯度同步所花费的时间
数据加载瓶颈:识别数据加载是否限制了训练吞吐量
内核效率:分析哪些操作花费的时间最长并进行相应优化
带有 PyTorch Profiler 和跟踪的 Tensorboard 插件。#
生成 trace.json 文件后,您可以使用 Tensorboard,或将 trace.json 拖到 Perfetto UI 或 chrome://tracing 中来可视化您的性能分析结果。
使用以下脚本启动 Tensorboard。
pip install torch_tb_profiler

# Once you run the above code, the profiling result is saved under `/mnt/cluster_storage/logs/`
tensorboard --logdir=/mnt/cluster_storage/logs/
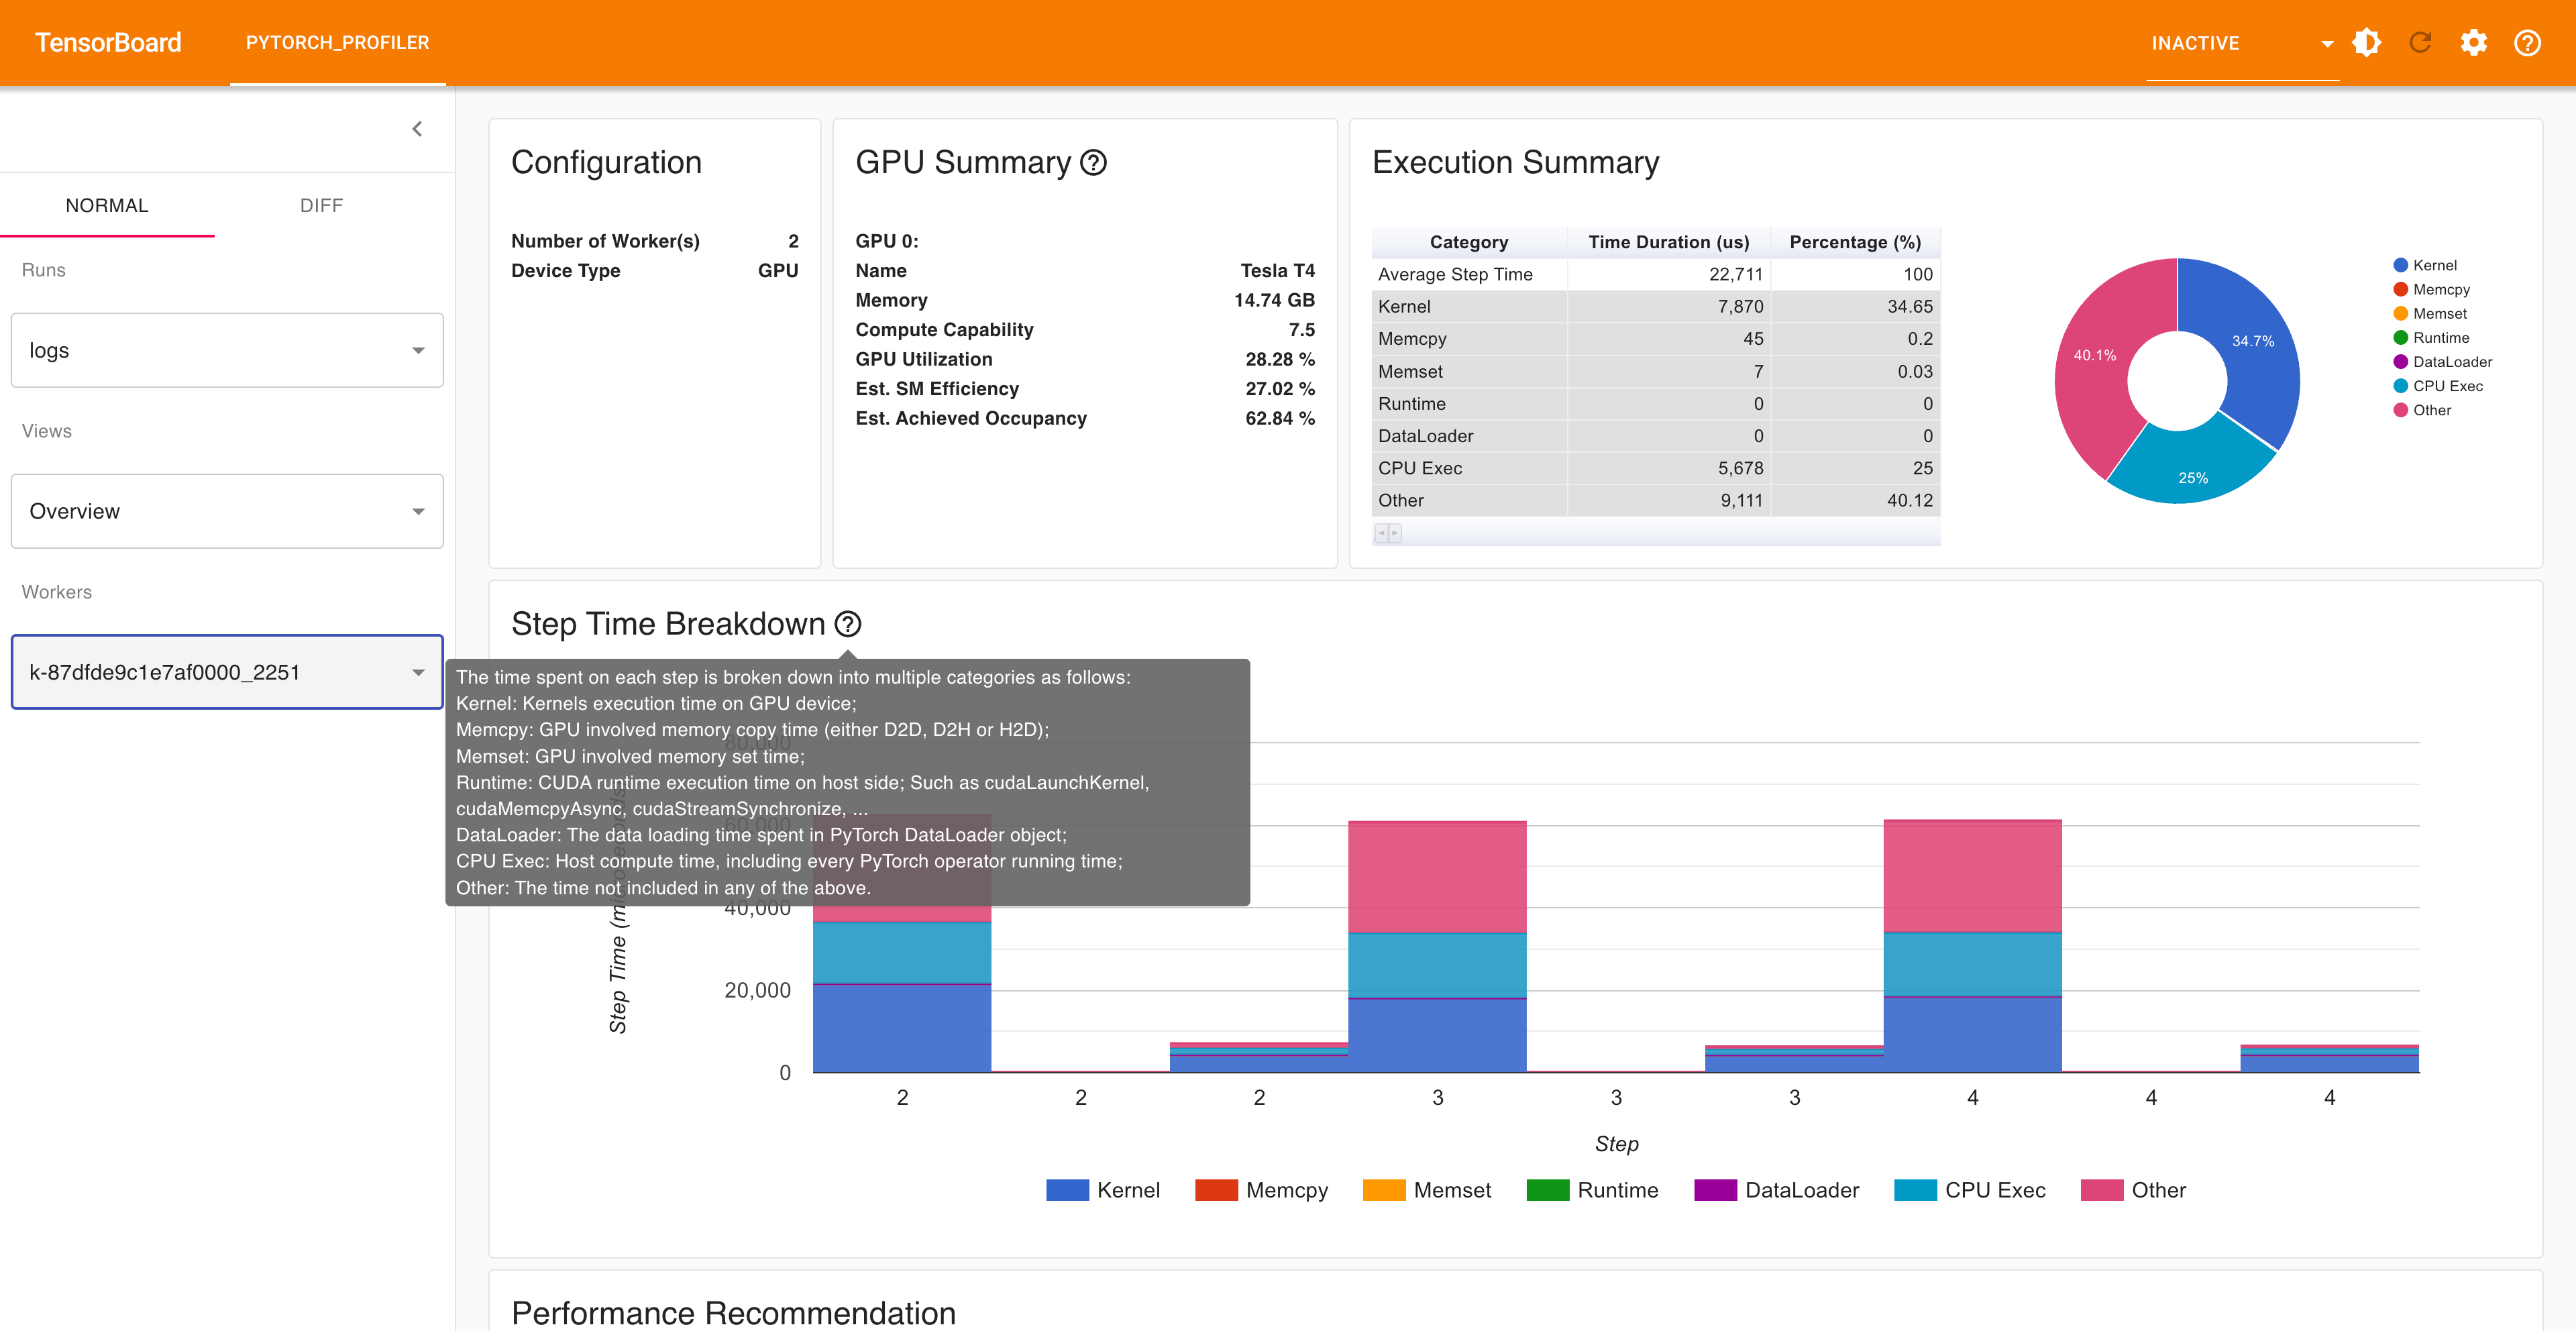
在浏览器中打开 TensorBoard 性能分析 URL,您将看到 Profiler 插件页面,如下所示。
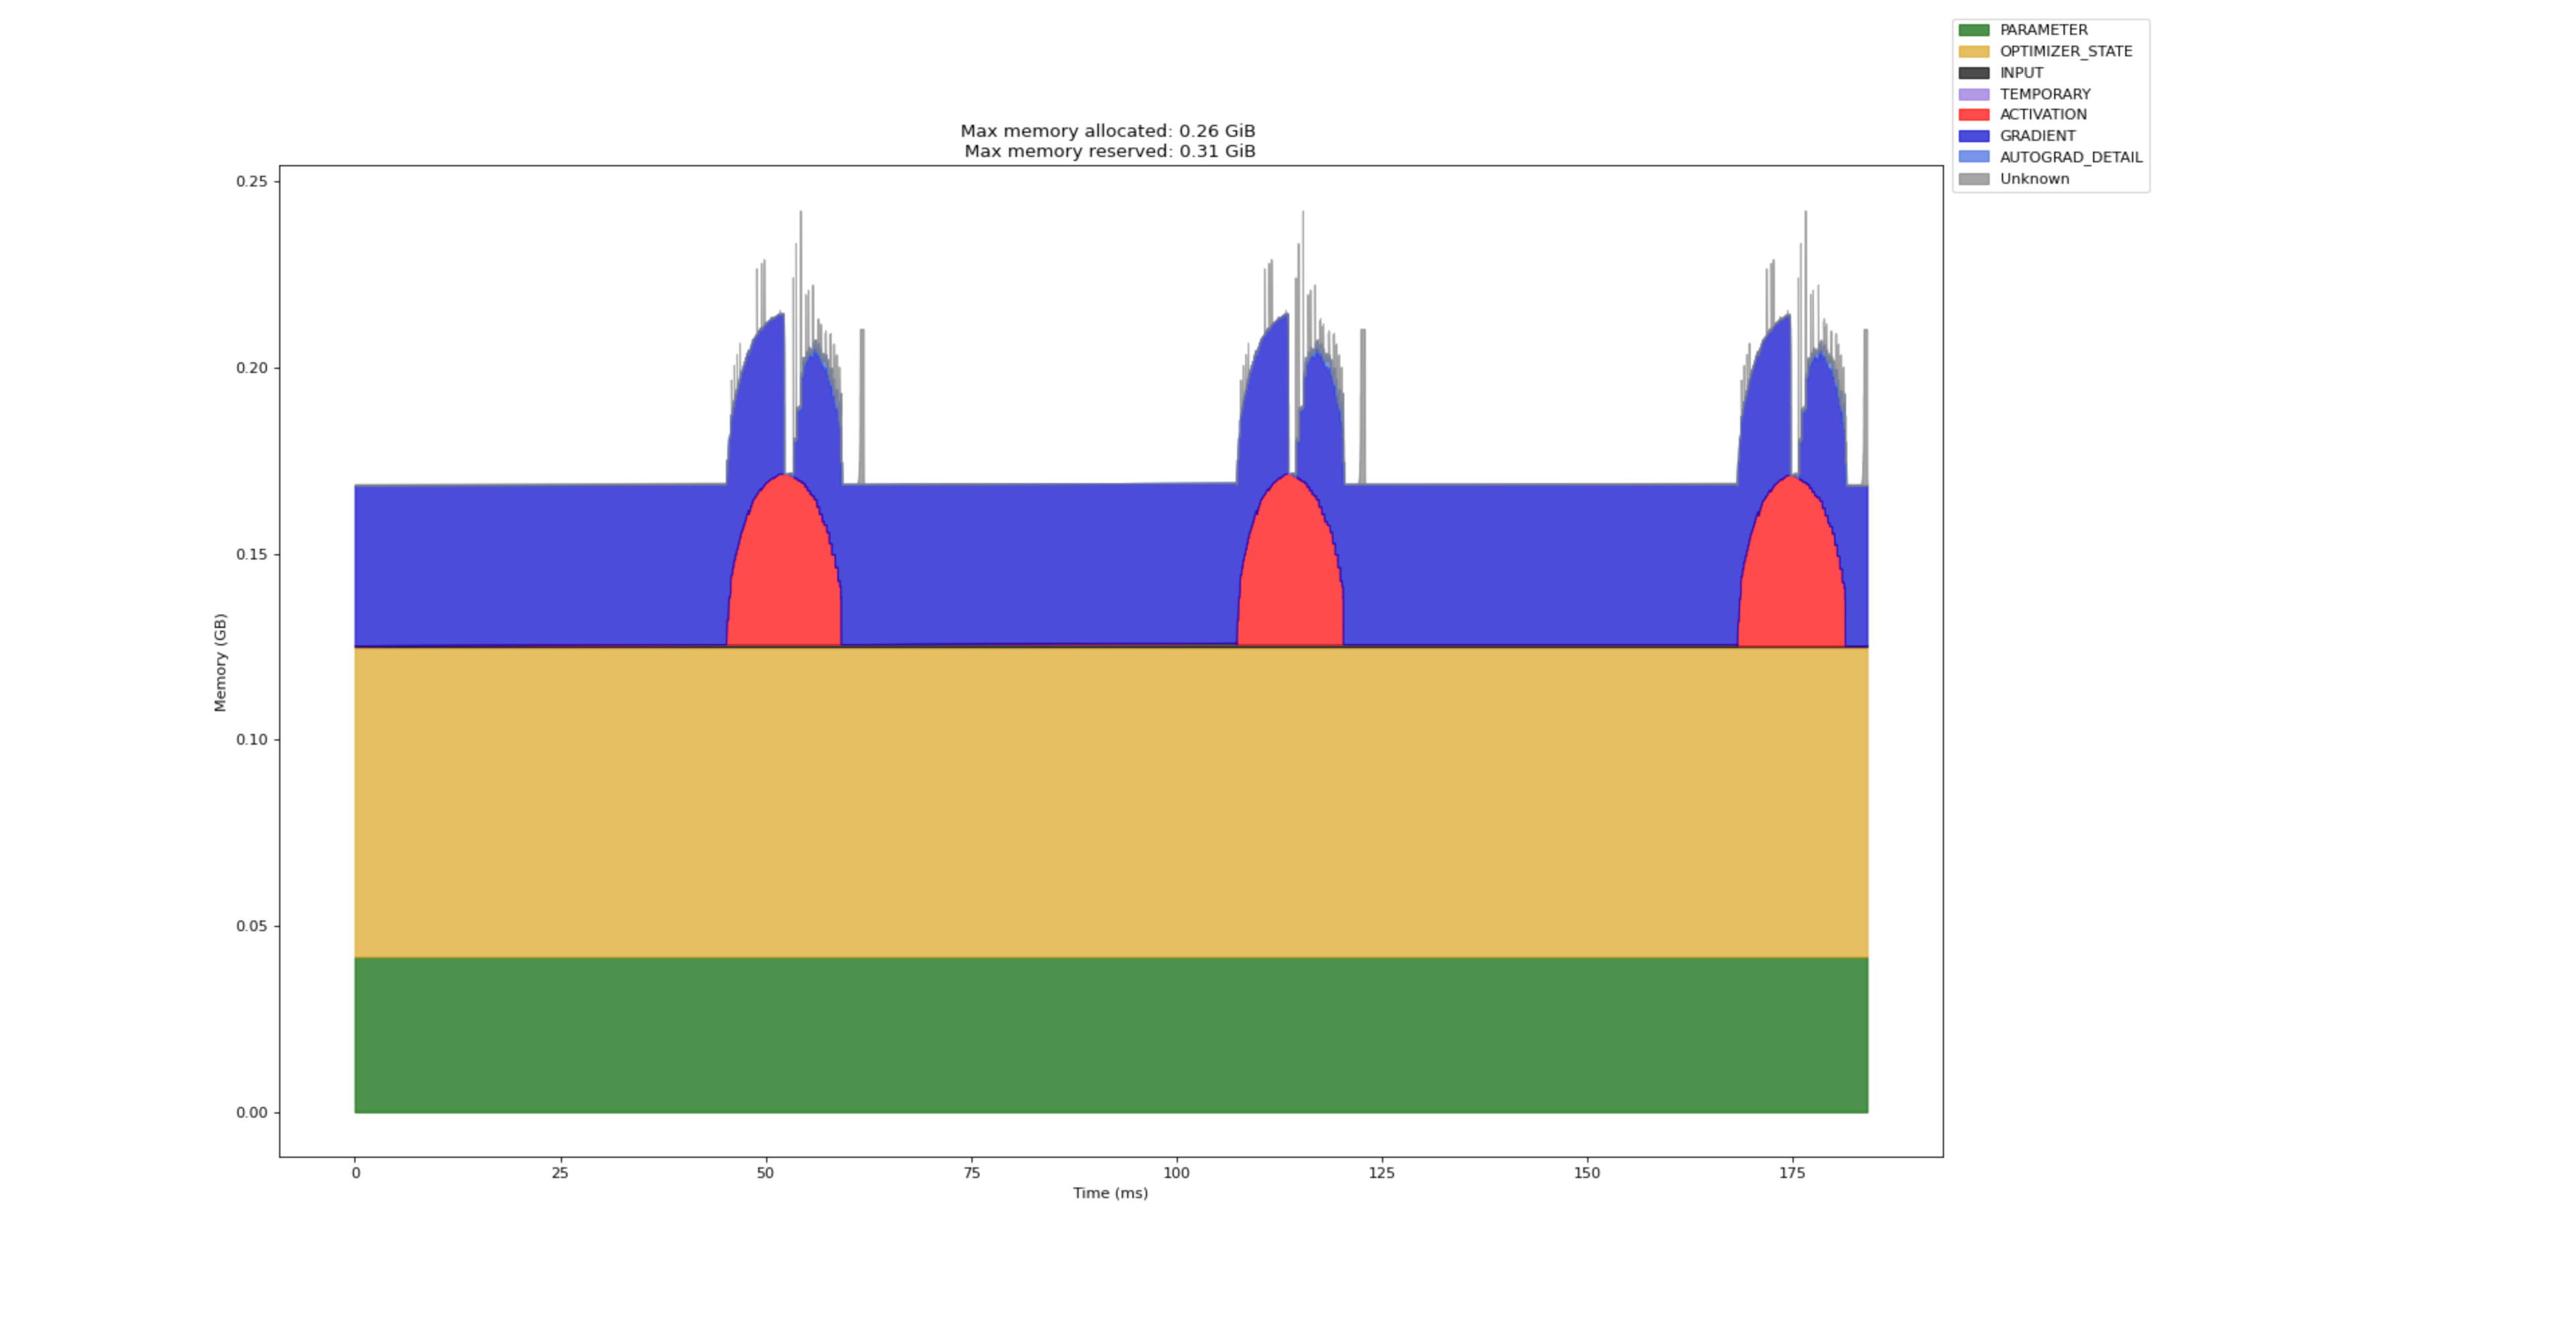
以下页面显示了工作节点特定的内存配置文件,显示了一段时间内的内存使用情况,有助于识别内存泄漏和优化机会。
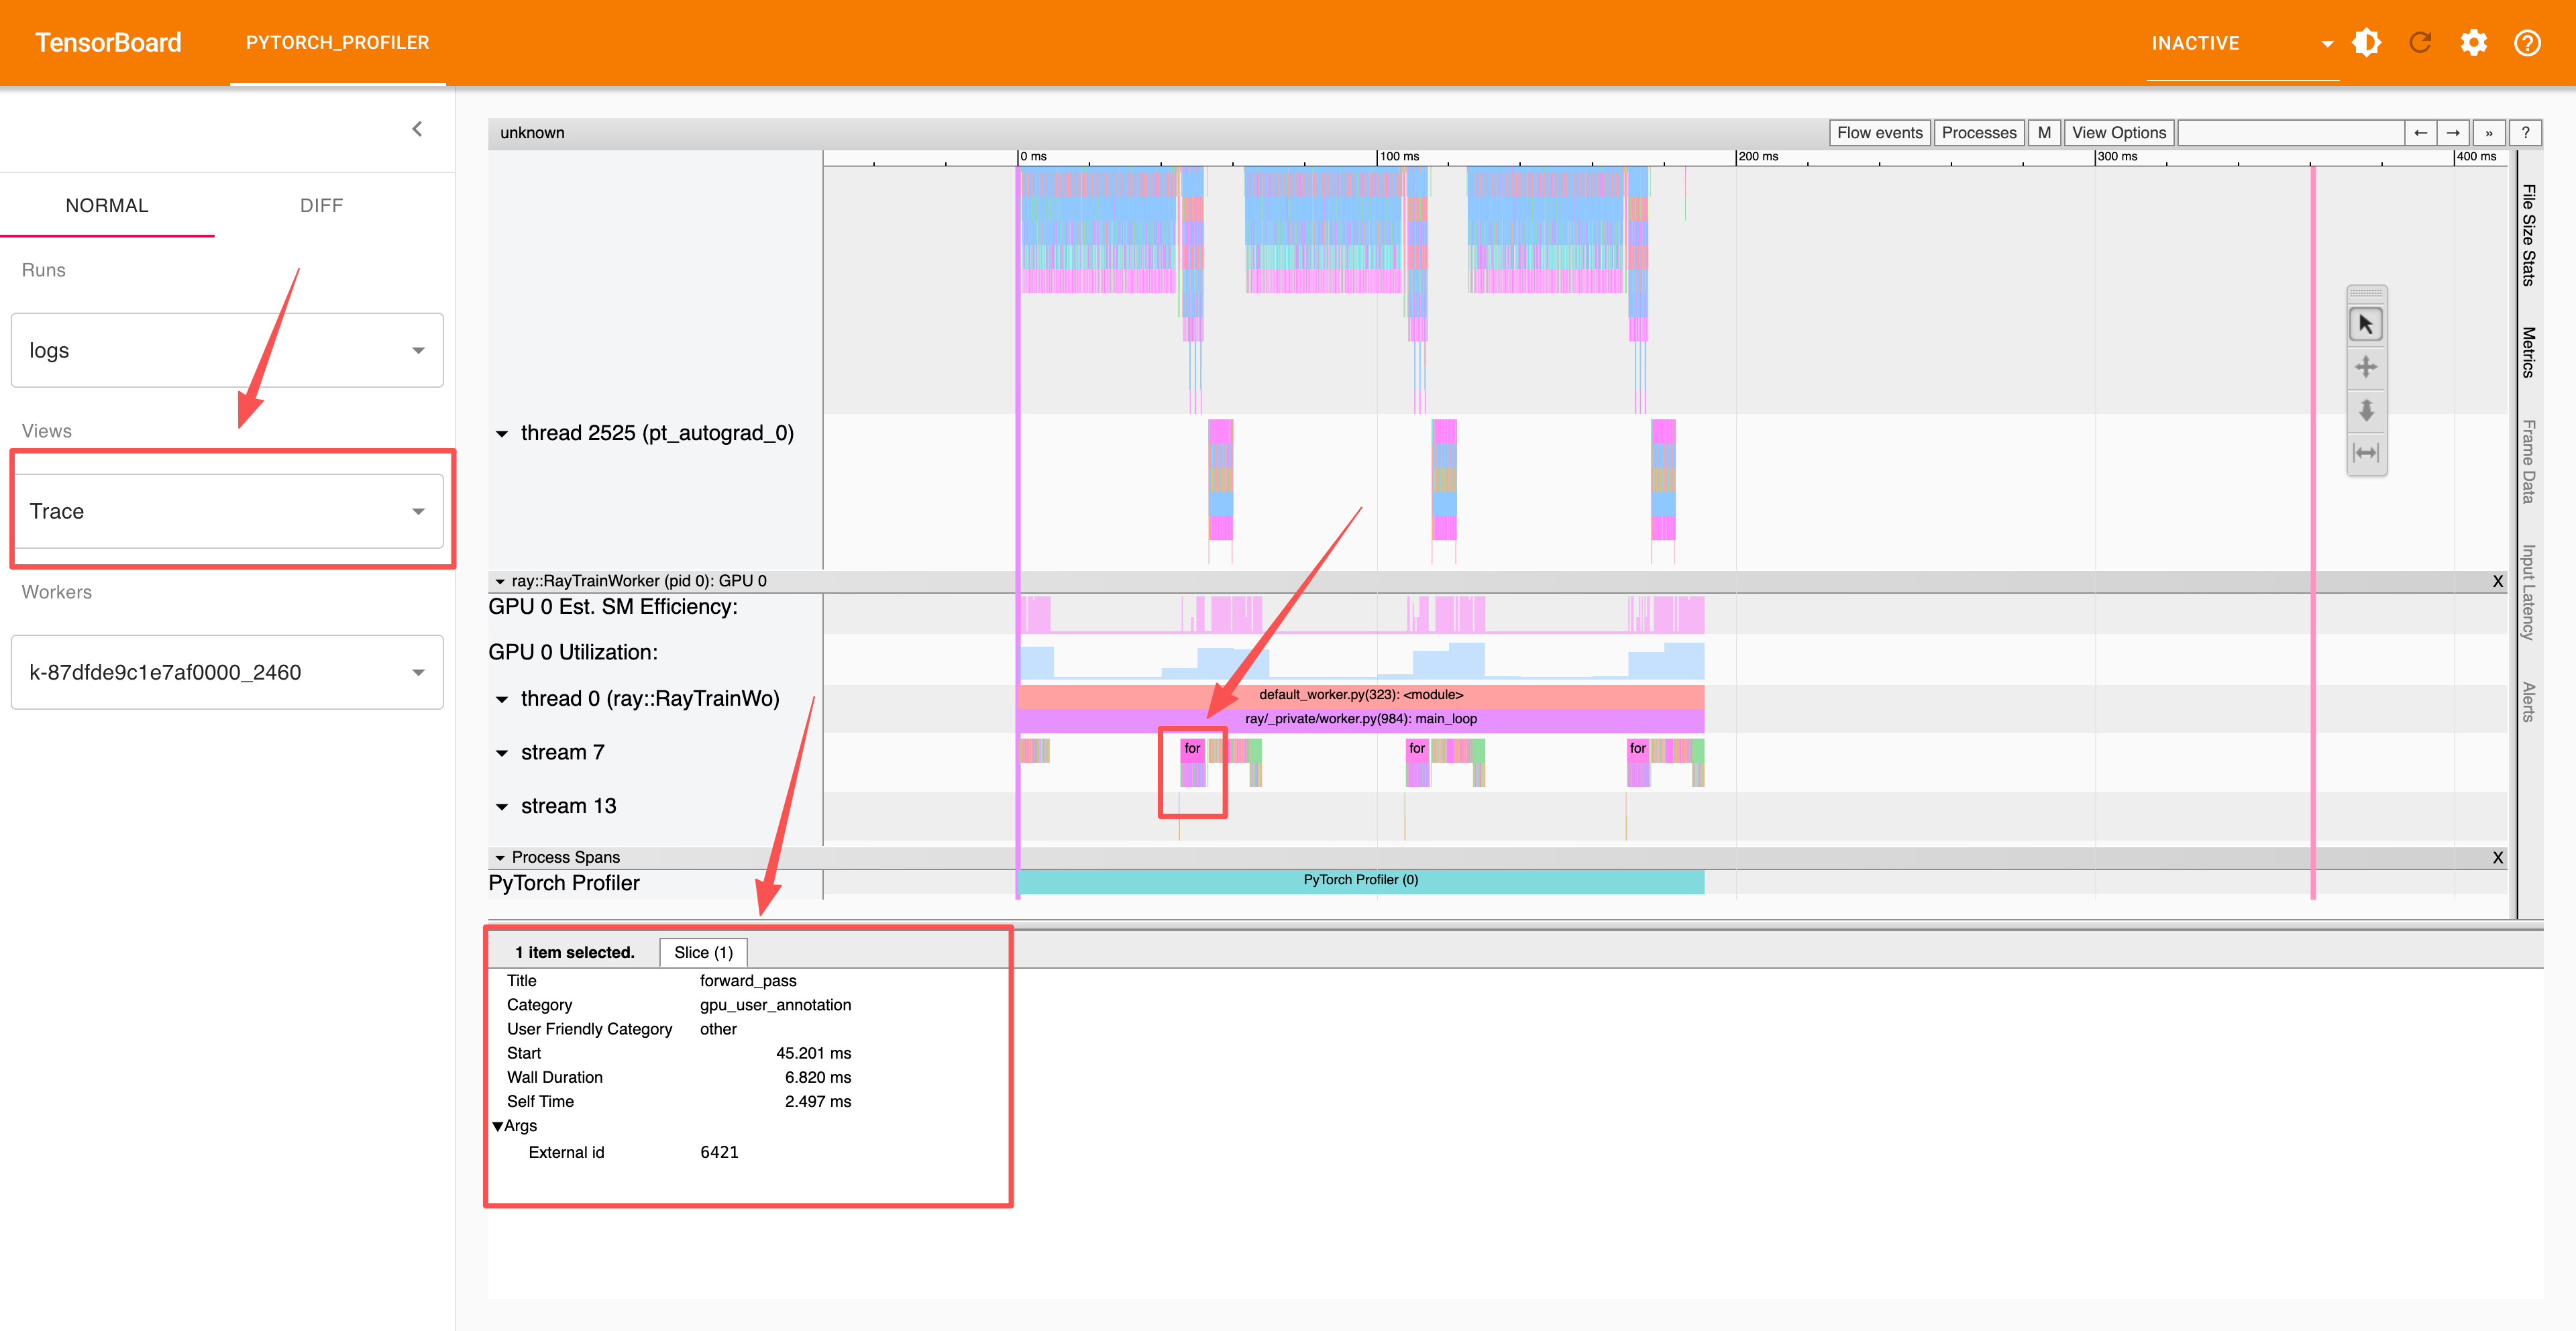
高级部分使用 record_function 上下文对单个操作进行性能分析,您可以在跟踪部分中查看这些分析结果。
总结#
在本笔记本中,您学习了如何使用 PyTorch Profiler 对 Ray Train 工作负载进行性能分析
单机性能分析:从基本的性能分析基础知识开始,学习如何将 PyTorch Profiler 集成到您的训练循环中以监控性能并识别瓶颈。
分布式性能分析:扩展到使用 Ray Train 进行多工作节点分布式训练,从而实现跨多个 GPU 和多台机器的性能分析,以识别通信开销和负载均衡问题。
高级性能分析技术:探索自定义性能分析计划、操作级别性能分析以及包括 TensorBoard 跟踪、内存时间线和 Chrome 跟踪在内的全面数据导出。
性能优化:通过详细的性能分析,深入了解 GPU 利用率、内存使用模式和训练效率。