使用 Prometheus 和 Grafana#
本节将介绍如何使用 Prometheus 和 Grafana 在 Kubernetes 中监控 Ray 集群。
如果你对 Kubernetes 上的 Prometheus 和 Grafana 没有经验,请观看此 YouTube 播放列表。
准备工作#
克隆 KubeRay 仓库 并检出 master 分支。本教程需要仓库中的几个文件。
步骤 1:使用 Kind 创建 Kubernetes 集群#
kind create cluster
步骤 2:通过 Helm chart 安装 Kubernetes Prometheus Stack#
# Path: kuberay/
./install/prometheus/install.sh

# Check the installation
kubectl get all -n prometheus-system

# (part of the output)
# NAME                                                  READY   UP-TO-DATE   AVAILABLE   AGE
# deployment.apps/prometheus-grafana                    1/1     1            1           46s
# deployment.apps/prometheus-kube-prometheus-operator   1/1     1            1           46s
# deployment.apps/prometheus-kube-state-metrics         1/1     1            1           46s
KubeRay 提供了一个 install.sh 脚本,用于自动在
prometheus-system命名空间中安装 kube-prometheus-stack v48.2.1 chart 和相关自定义资源,包括 PodMonitor 和 PrometheusRule。我们对 kube-prometheus-stack chart 中的原始
values.yaml进行了一些修改,以允许在 Ray Dashboard 中嵌入 Grafana 面板。更多详细信息请参阅 overrides.yaml。grafana: grafana.ini: security: allow_embedding: true auth.anonymous: enabled: true org_role: Viewer
步骤 3:安装 KubeRay operator#
按照 本文档 通过 Helm 仓库安装最新的稳定版 KubeRay operator。
步骤 4:安装 RayCluster#
# path: ray-operator/config/samples/
kubectl apply -f ray-cluster.embed-grafana.yaml

# Check ${RAYCLUSTER_HEAD_POD}
kubectl get pod -l ray.io/node-type=head

# Example output:
# NAME                                  READY   STATUS    RESTARTS   AGE
# raycluster-embed-grafana-head-98fqt   1/1     Running   0          11m

# Wait until all Ray Pods are running and forward the port of the Prometheus metrics endpoint in a new terminal.
kubectl port-forward ${RAYCLUSTER_HEAD_POD} 8080:8080
curl localhost:8080

# Example output (Prometheus metrics format):
# # HELP ray_spill_manager_request_total Number of {spill, restore} requests.
# # TYPE ray_spill_manager_request_total gauge
# ray_spill_manager_request_total{Component="raylet", NodeAddress="10.244.0.13", SessionName="session_2025-01-02_07-58-21_419367_11", Type="FailedDeletion", Version="2.9.0", container="ray-head", endpoint="metrics", instance="10.244.0.13:8080", job="prometheus-system/ray-head-monitor", namespace="default", pod="raycluster-embed-grafana-head-98fqt", ray_io_cluster="raycluster-embed-grafana"} 0

# Ensure that the port (8080) for the metrics endpoint is also defined in the head's Kubernetes service.
kubectl get service

# NAME                                TYPE        CLUSTER-IP      EXTERNAL-IP   PORT(S)                                                    AGE
# raycluster-embed-grafana-head-svc   ClusterIP   None            <none>        44217/TCP,10001/TCP,44227/TCP,8265/TCP,6379/TCP,8080/TCP   13m
KubeRay 默认通过内置导出器在端口 8080 暴露 Prometheus 指标端点。因此,我们不需要安装任何外部导出器。
如果你想将指标端点配置到不同的端口,更多详细信息请参阅 kuberay/#954。
Prometheus 指标格式
# HELP: 描述此指标的含义。# TYPE: 更多详细信息请参阅 本文档。
ray-cluster.embed-grafana.yaml 中定义了三个必需的环境变量。更多关于这些环境变量的详细信息请参阅 配置和管理 Ray Dashboard。
env:
  - name: RAY_GRAFANA_IFRAME_HOST
    value: http://127.0.0.1:3000
  - name: RAY_GRAFANA_HOST
    value: http://prometheus-grafana.prometheus-system.svc:80
  - name: RAY_PROMETHEUS_HOST
    value: http://prometheus-kube-prometheus-prometheus.prometheus-system.svc:9090
请注意,我们没有在 head Pod 中部署 Grafana,因此需要同时设置
RAY_GRAFANA_IFRAME_HOST和RAY_GRAFANA_HOST。RAY_GRAFANA_HOST用于 head Pod 向后端的 Grafana 发送健康检查请求。RAY_GRAFANA_IFRAME_HOST用于你的浏览器从 Grafana 服务器而不是 head Pod 获取 Grafana 面板。因为在本例中我们将 Grafana 的端口转发到127.0.0.1:3000,所以我们将RAY_GRAFANA_IFRAME_HOST设置为http://127.0.0.1:3000。需要
http://前缀。
步骤 5:使用 PodMonitor 收集 Head Node 指标#
RayService 为 head Pod 创建了两个 Kubernetes 服务;一个由 RayService 管理,另一个由底层的 RayCluster 管理。因此,建议使用 PodMonitor 监控 head Pod 的指标,以避免在使用 ServiceMonitor 时可能导致重复计算相同指标的配置错误。
apiVersion: monitoring.coreos.com/v1
kind: PodMonitor
metadata:
  labels:
    # `release: $HELM_RELEASE`: Prometheus can only detect PodMonitor with this label.
    release: prometheus
  name: ray-head-monitor
  namespace: prometheus-system
spec:
  jobLabel: ray-head
  # Only select Kubernetes Pods in the "default" namespace.
  namespaceSelector:
    matchNames:
      - default
  # Only select Kubernetes Pods with "matchLabels".
  selector:
    matchLabels:
      ray.io/node-type: head
  # A list of endpoints allowed as part of this PodMonitor.
  podMetricsEndpoints:
    - port: metrics
      relabelings:
        - action: replace
          sourceLabels:
            - __meta_kubernetes_pod_label_ray_io_cluster
          targetLabel: ray_io_cluster
    - port: as-metrics # autoscaler metrics
      relabelings:
        - action: replace
          sourceLabels:
            - __meta_kubernetes_pod_label_ray_io_cluster
          targetLabel: ray_io_cluster
    - port: dash-metrics # dashboard metrics
      relabelings:
        - action: replace
          sourceLabels:
            - __meta_kubernetes_pod_label_ray_io_cluster
          targetLabel: ray_io_cluster
install.sh 脚本创建了上述 YAML 示例 podMonitor.yaml,因此你无需手动创建。
更多关于配置的详细信息请参阅官方 PodMonitor 文档。
release: $HELM_RELEASE: Prometheus 只能通过此标签检测 PodMonitor。更多详细信息请参阅 此处。
helm ls -n prometheus-system
# ($HELM_RELEASE is "prometheus".)
# NAME            NAMESPACE               REVISION        UPDATED                                 STATUS          CHART                           APP VERSION
# prometheus      prometheus-system       1               2023-02-06 06:27:05.530950815 +0000 UTC deployed        kube-prometheus-stack-44.3.1    v0.62.0

kubectl get prometheuses.monitoring.coreos.com -n prometheus-system -oyaml
# podMonitorSelector:
#   matchLabels:
#     release: prometheus
# ruleSelector:
#   matchLabels:
#     release: prometheus
Prometheus 使用
namespaceSelector和selector选择 Kubernetes Pod。kubectl get pod -n default -l ray.io/node-type=head # NAME READY STATUS RESTARTS AGE # raycluster-embed-grafana-head-khfs4 1/1 Running 0 4m38s
relabelings: 此配置将抓取到的指标中的标签__meta_kubernetes_pod_label_ray_io_cluster重命名为ray_io_cluster。它确保每个指标都包含 Pod 所属的 RayCluster 名称。此配置在部署多个 RayCluster 时特别有用,可以区分指标。例如,带有ray_io_cluster标签的指标可能如下所示:ray_node_cpu_count{SessionName="session_2025-01-02_07-58-21_419367_11", container="ray-head", endpoint="metrics", instance="10.244.0.13:8080", ip="10.244.0.13", job="raycluster-embed-grafana-head-svc", namespace="default", pod="raycluster-embed-grafana-head-98fqt", ray_io_cluster="raycluster-embed-grafana", service="raycluster-embed-grafana-head-svc"}
在本例中,
raycluster-embed-grafana是 RayCluster 的名称。
步骤 6:使用 PodMonitor 收集 Worker Node 指标#
与 head Pod 类似,本教程也使用 PodMonitor 收集 worker Pod 的指标。对 head Pod 和 worker Pod 使用单独的 PodMonitor 是因为 head Pod 暴露了多个指标端点,而 worker Pod 只暴露一个。
注意:你可以创建一个 Kubernetes 服务,使用 worker pod 的共同标签子集作为选择器,但是,这种配置并不理想,因为 worker 彼此独立,也就是说,它们不是由 replicaset 控制器生成的副本集合。由于这种行为,请避免使用 Kubernetes 服务将它们组合在一起。
apiVersion: monitoring.coreos.com/v1
kind: PodMonitor
metadata:
  name: ray-workers-monitor
  namespace: prometheus-system
  labels:
    # `release: $HELM_RELEASE`: Prometheus can only detect PodMonitor with this label.
    release: prometheus
spec:
  jobLabel: ray-workers
  # Only select Kubernetes Pods in the "default" namespace.
  namespaceSelector:
    matchNames:
      - default
  # Only select Kubernetes Pods with "matchLabels".
  selector:
    matchLabels:
      ray.io/node-type: worker
  # A list of endpoints allowed as part of this PodMonitor.
  podMetricsEndpoints:
  - port: metrics
    relabelings:
    - sourceLabels: [__meta_kubernetes_pod_label_ray_io_cluster]
      targetLabel: ray_io_cluster
namespaceSelector和selector中的 PodMonitor 用于选择 Kubernetes Pod。kubectl get pod -n default -l ray.io/node-type=worker # NAME READY STATUS RESTARTS AGE # raycluster-kuberay-worker-workergroup-5stpm 1/1 Running 0 3h16m
步骤 7:使用 Recording Rules 收集自定义指标#
记录规则(Recording Rules) 允许 KubeRay 预计算常用或计算成本高昂的 PromQL 表达式,并将其结果保存为自定义指标。请注意,此行为与 自定义应用程序级指标 不同,后者用于 Ray 应用程序的可观测性。
apiVersion: monitoring.coreos.com/v1
kind: PrometheusRule
metadata:
  name: ray-cluster-gcs-rules
  namespace: prometheus-system
  labels:
    # `release: $HELM_RELEASE`: Prometheus can only detect Recording Rules with this label.
    release: prometheus
spec:
  groups:
- #  Rules within a group are run periodically with the same evaluation interval(30s in this example).
    name: ray-cluster-main-staging-gcs.rules
    # How often rules in the group are evaluated.
    interval: 30s
    rules:
    - # The name of the custom metric.
      # Also see best practices for naming metrics created by recording rules:
      # https://prometheus.ac.cn/docs/practices/rules/#recording-rules
      record: ray_gcs_availability_30d
      # PromQL expression.
      expr: |
      (
        100 * (
          sum(rate(ray_gcs_update_resource_usage_time_bucket{container="ray-head", le="20.0"}[30d]))
          /
          sum(rate(ray_gcs_update_resource_usage_time_count{container="ray-head"}[30d]))
        )
      )
上面的 PromQL 表达式是:$\(\frac{ 过去 30 天内 RTT 小于 20ms 的资源使用更新 RPC 数量 }{ 过去 30 天内资源使用更新 RPC 总数 } \times 100 \)$
上述记录规则是 prometheusRules.yaml 中定义的规则之一,由 install.sh 创建。因此,无需在此处创建任何内容。
更多关于配置的详细信息请参阅官方 PrometheusRule 文档。
release: $HELM_RELEASE: Prometheus 只能通过此标签检测 PrometheusRule。更多详细信息请参阅 此处。PrometheusRule 可以在运行时重新加载。如果需要重新配置规则,请使用
kubectl apply {修改后的 prometheusRules.yaml}。
步骤 8:使用 Alerting Rules 定义警报条件#
警报规则(Alerting rules) 允许我们基于 PromQL 表达式定义警报条件,并将触发的警报通知发送到 Alertmanager,后者在简单的警报定义之上提供了汇总、通知速率限制、静默和警报依赖等功能。
apiVersion: monitoring.coreos.com/v1
kind: PrometheusRule
metadata:
  name: ray-cluster-gcs-rules
  namespace: prometheus-system
  labels:
    # `release: $HELM_RELEASE`: Prometheus can only detect Alerting Rules with this label.
    release: prometheus
spec:
  groups:
  - name: ray-cluster-main-staging-gcs.rules
    # How often rules in the group are evaluated.
    interval: 30s
    rules:
    - alert: MissingMetricRayGlobalControlStore
      # A set of informational labels. Annotations can be used to store longer additional information compared to rules.0.labels.
      annotations:
        description: Ray GCS is not emitting any metrics for Resource Update requests
        summary: Ray GCS is not emitting metrics anymore
      # PromQL expression.
      expr: |
                      (
                       absent(ray_gcs_update_resource_usage_time_bucket) == 1
                      )
      # Time that Prometheus will wait and check if the alert continues to be active during each evaluation before firing the alert.
      # firing alerts may be due to false positives or noise if the setting value is too small.
      # On the other hand, if the value is too big, the alerts may not be handled in time.
      for: 5m
      # A set of additional labels to be attached to the alert.
      # It is possible to overwrite the labels in metadata.labels, so make sure one of the labels match the label in ruleSelector.matchLabels.
      labels:
        severity: critical
上述 PromQL 表达式检查
ray_gcs_update_resource_usage_time_bucket指标是否存在时间序列。更多详细信息请参阅 absent()。上述警报规则是 prometheusRules.yaml 中定义的规则之一,由 install.sh 创建。因此,无需在此处创建任何内容。
警报规则的配置方式与记录规则相同。
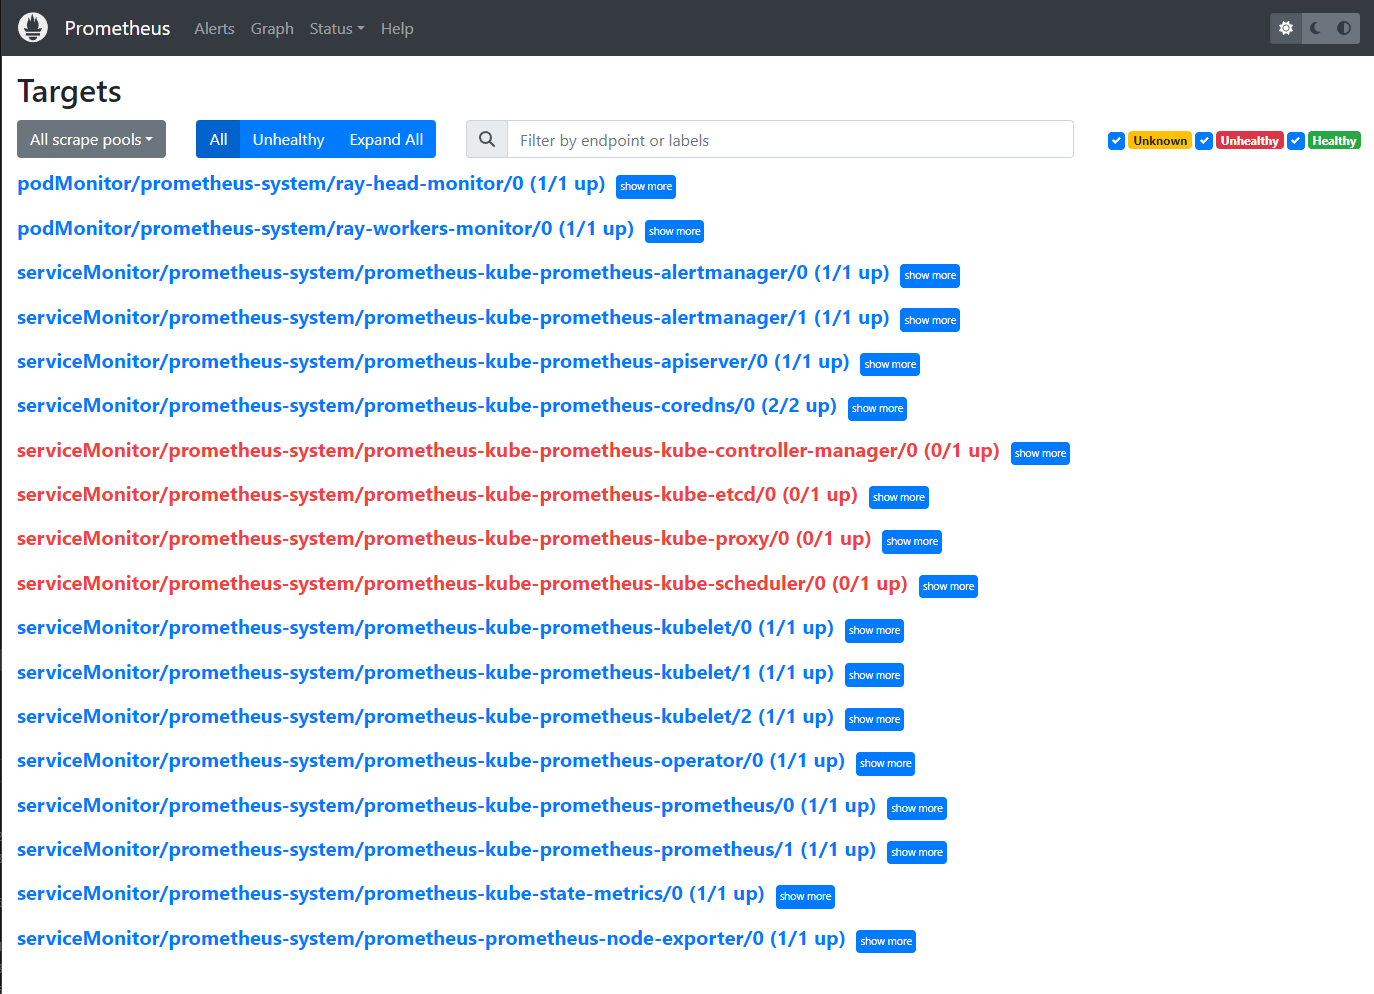
步骤 9:访问 Prometheus Web UI#
# Forward the port of Prometheus Web UI in the Prometheus server Pod.
kubectl port-forward prometheus-prometheus-kube-prometheus-prometheus-0 -n prometheus-system 9090:9090
转到
${YOUR_IP}:9090/targets(例如127.0.0.1:9090/targets)。你应该能看到:podMonitor/prometheus-system/ray-workers-monitor/0 (1/1 up)serviceMonitor/prometheus-system/ray-head-monitor/0 (1/1 up)
步骤 10:访问 Grafana#
# Forward the port of Grafana
kubectl port-forward deployment/prometheus-grafana -n prometheus-system 3000:3000
# Note: You need to update `RAY_GRAFANA_IFRAME_HOST` if you expose Grafana to a different port.

# Check ${YOUR_IP}:3000/login for the Grafana login page (e.g. 127.0.0.1:3000/login).
# The default username is "admin" and the password is "prom-operator".
注意:不建议在生产环境中使用
kubectl port-forward。有关在反向代理后面暴露 Grafana 的信息,请参阅 此 Grafana 文档。
默认密码由 kube-prometheus-stack chart 的 values.yaml 中的
grafana.adminPassword定义。成功登录 Grafana 后,我们可以通过 dashboard_default.json 将 Ray Dashboard 导入 Grafana。
点击左侧面板中的“Dashboards”图标。
点击“New”。
点击“Import”。
点击“Upload JSON file”。
选择一个 JSON 文件。
情况 1:如果你使用 Ray 2.9.0,可以使用 GitHub 仓库中的示例配置文件。文件名的格式为
xxx_grafana_dashboard.json。情况 2:否则,你应该从 head Pod 中的
/tmp/ray/session_latest/metrics/grafana/dashboards/导入 JSON 文件。你可以使用kubectl cp将文件从 head Pod 复制到本地机器。
点击“Import”。
TODO: 注意,手动导入 dashboard 并不理想。我们应该找到一种自动导入 dashboard 的方法。
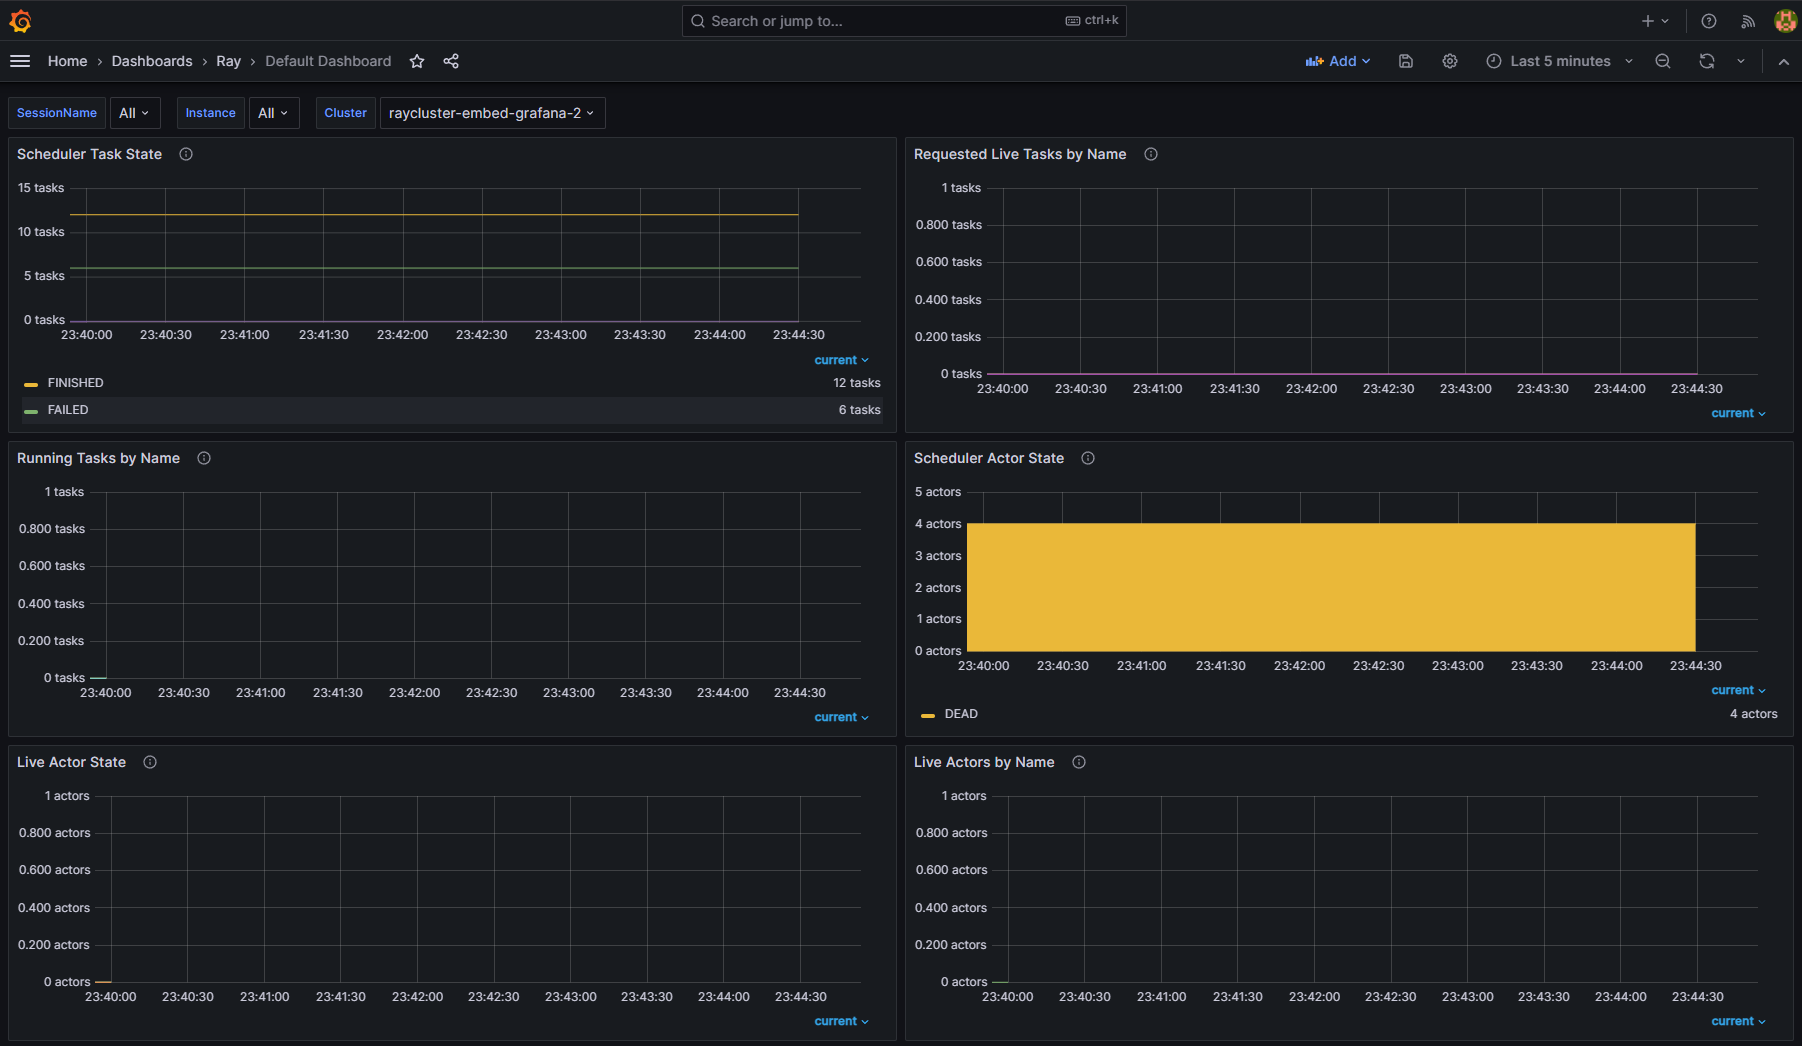
步骤 11:查看不同 RayCluster CR 的指标#
将 Ray Dashboard 导入 Grafana 后,你可以使用 Cluster 变量过滤指标。当你使用提供的 PodMonitor 配置时,Ray Dashboard 会自动默认应用此变量。你无需为此标签设置进行任何额外配置。
如果你有多个 RayCluster 自定义资源,Cluster 变量允许你过滤特定集群的指标。此功能确保你可以轻松监控或调试单个 RayCluster 实例,而不会被来自所有集群的数据淹没。
例如,在下图中,一个选择了 RayCluster raycluster-embed-grafana 的指标,另一个选择了 RayCluster raycluster-embed-grafana-2 的指标。

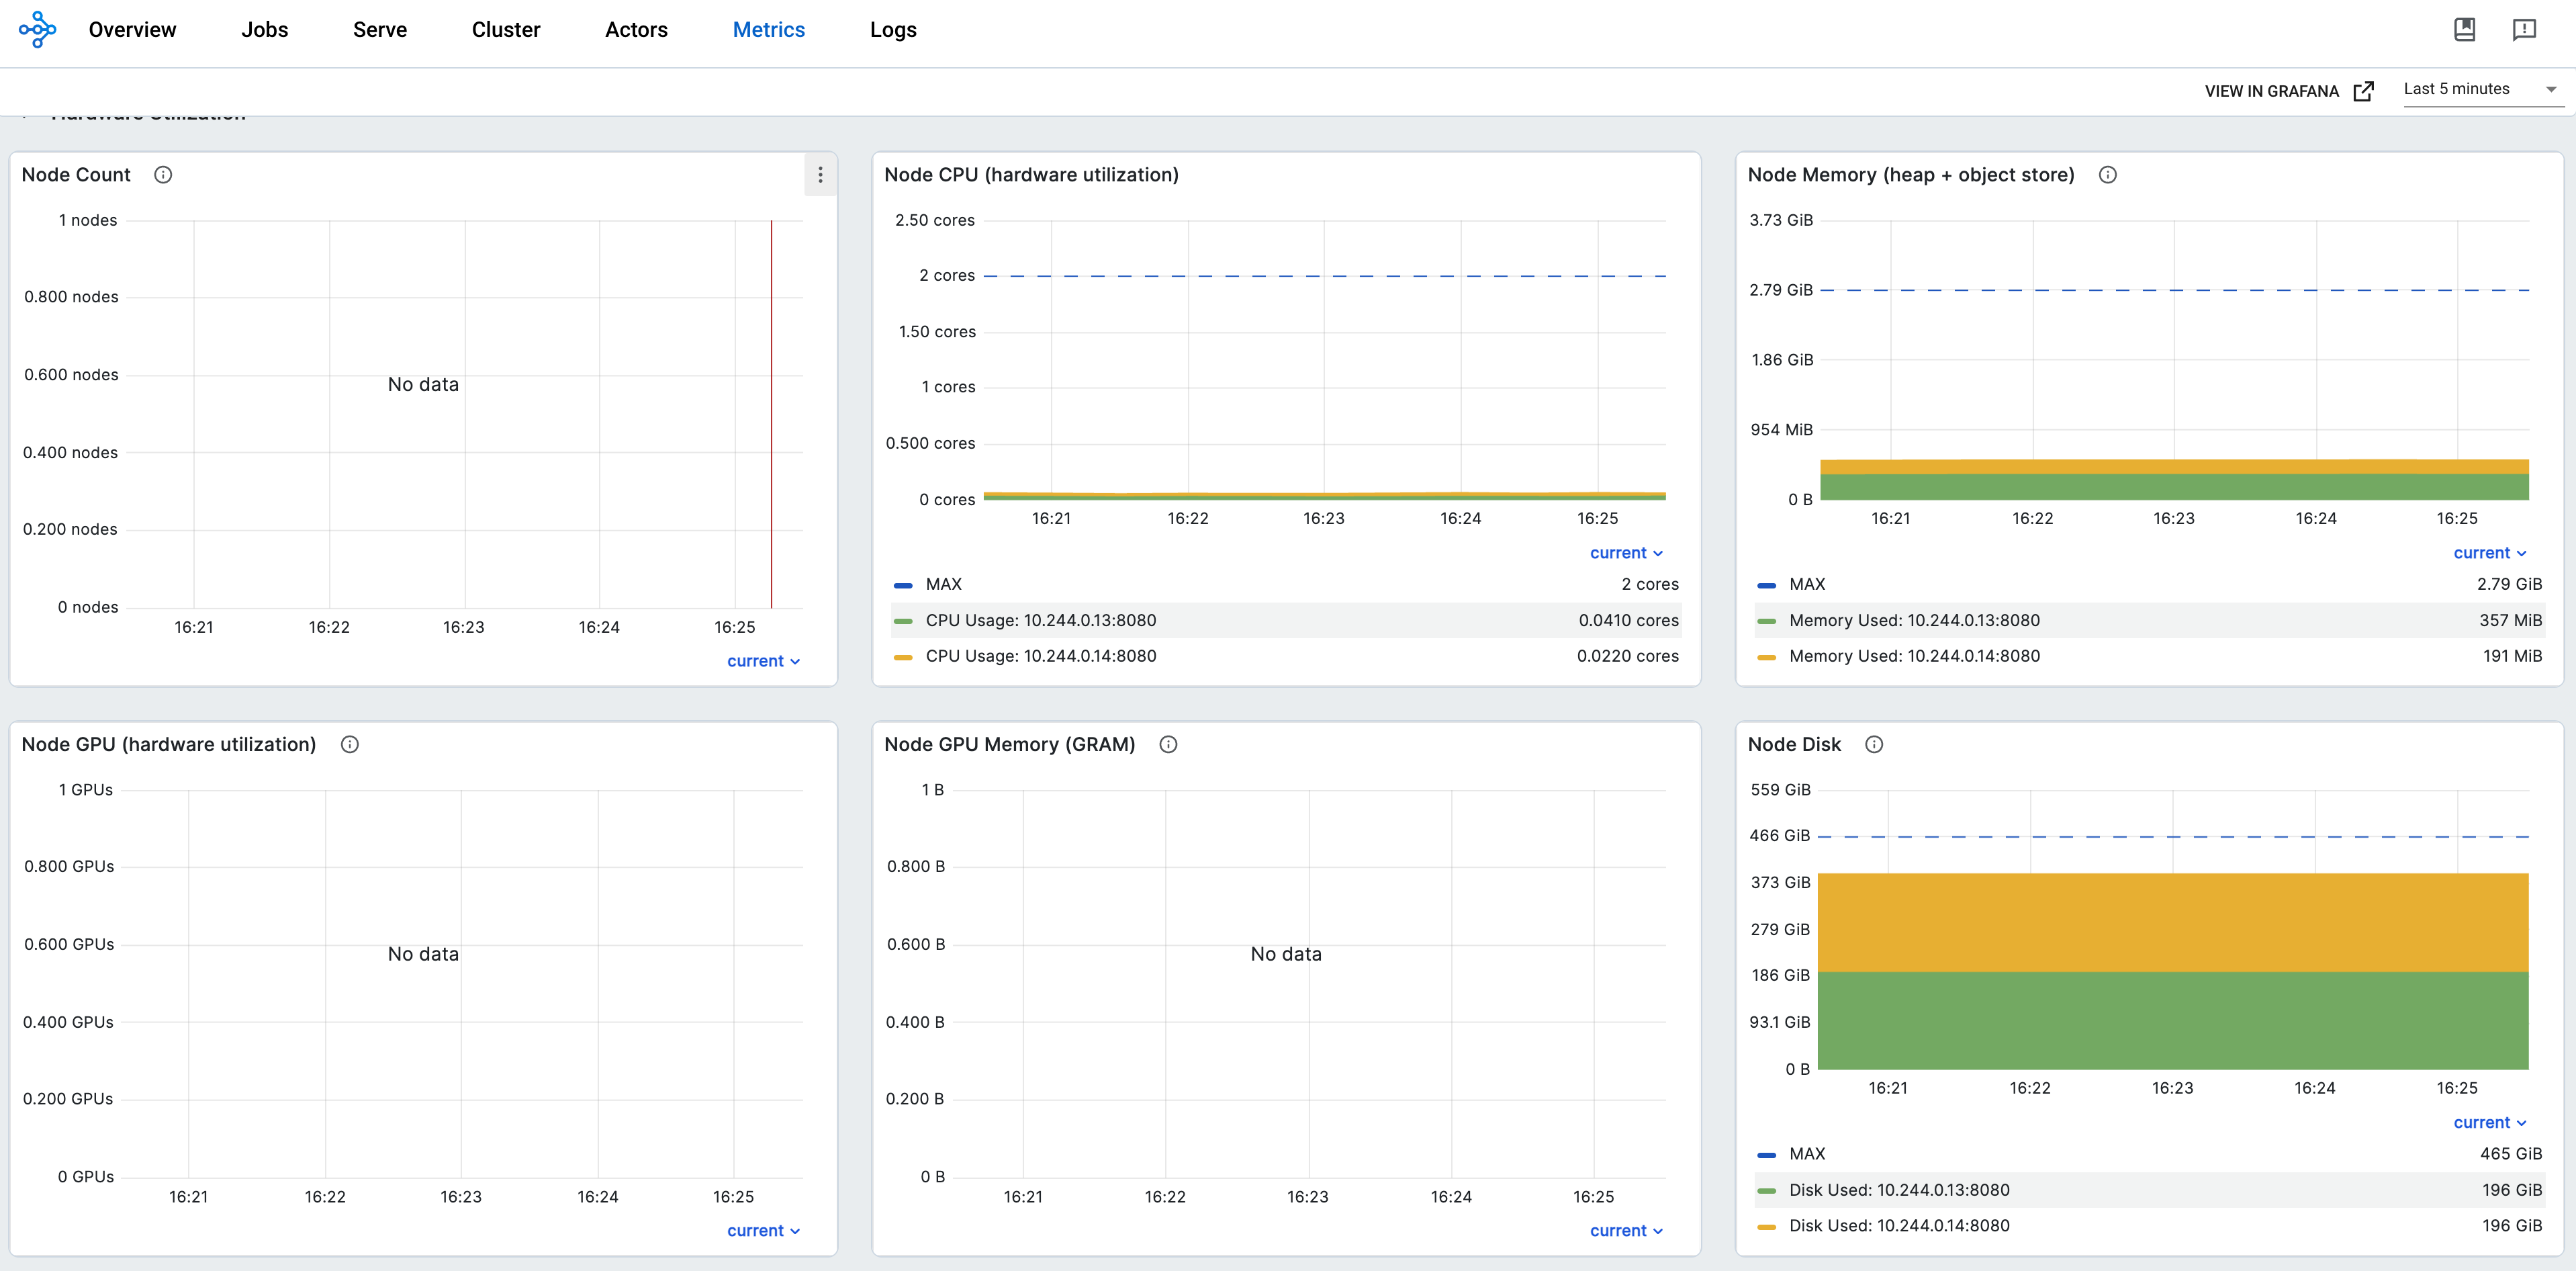
步骤 12:在 Ray Dashboard 中嵌入 Grafana 面板#
kubectl port-forward svc/raycluster-embed-grafana-head-svc 8265:8265
# Visit http://127.0.0.1:8265/#/metrics in your browser.