使用 py-spy 进行性能分析#
栈追踪和 CPU 性能图#
py-spy 是一个用于 Python 程序的采样分析器。它允许您在不重启程序或修改代码的情况下,可视化 Python 程序花费时间的位置。本节介绍如何配置 RayCluster YAML 文件以启用 py-spy,并在 Ray Dashboard 上查看栈追踪和 CPU 火焰图。
先决条件#
py-spy 需要 SYS_PTRACE 功能来读取进程内存。然而,Kubernetes 默认省略此功能。要启用性能分析,请在 head 和 worker Pod 的 template.spec.containers 中添加以下内容。
securityContext:
  capabilities:
    add:
    - SYS_PTRACE
注意
baseline和restrictedPod 安全标准禁止添加SYS_PTRACE。有关详细信息,请参阅Pod 安全标准。
在 Ray Dashboard 上检查 CPU 火焰图和栈追踪#
步骤 1:创建一个 Kind 集群#
kind create cluster
步骤 2:安装 KubeRay Operator#
按照 此文档 使用 Helm 仓库安装最新的稳定版 KubeRay Operator。
步骤 3:创建一个具有 SYS_PTRACE 功能的 RayCluster#
kubectl apply -f https://raw.githubusercontent.com/ray-project/kuberay/master/ray-operator/config/samples/ray-cluster.py-spy.yaml
步骤 4:转发 Dashboard 端口#
kubectl port-forward svc/raycluster-py-spy-head-svc 8265:8265
步骤 5:在 Head Pod 内运行示例 Job#
# Log in to the head Pod
kubectl exec -it ${YOUR_HEAD_POD} -- bash

# (Head Pod) Run a sample job in the Pod
# `long_running_task` includes a `while True` loop to ensure the task remains actively running indefinitely.
# This allows you ample time to view the Stack Trace and CPU Flame Graph via Ray Dashboard.
python3 samples/long_running_task.py
注意
如果你正在运行自己的示例,并且在查看 CPU 火焰图时遇到错误
Failed to write flamegraph: I/O error: No stack counts found,这可能是由于进程处于空闲状态。值得注意的是,使用sleep函数可能导致此状态。在这种情况下,py-spy 会过滤掉空闲的栈追踪。有关更多信息,请参阅此 issue。
步骤 6:使用 Ray Dashboard 进行性能分析#
访问 https://:8265/#/cluster。
点击
Stack Trace查看ray::long_running_task的栈追踪。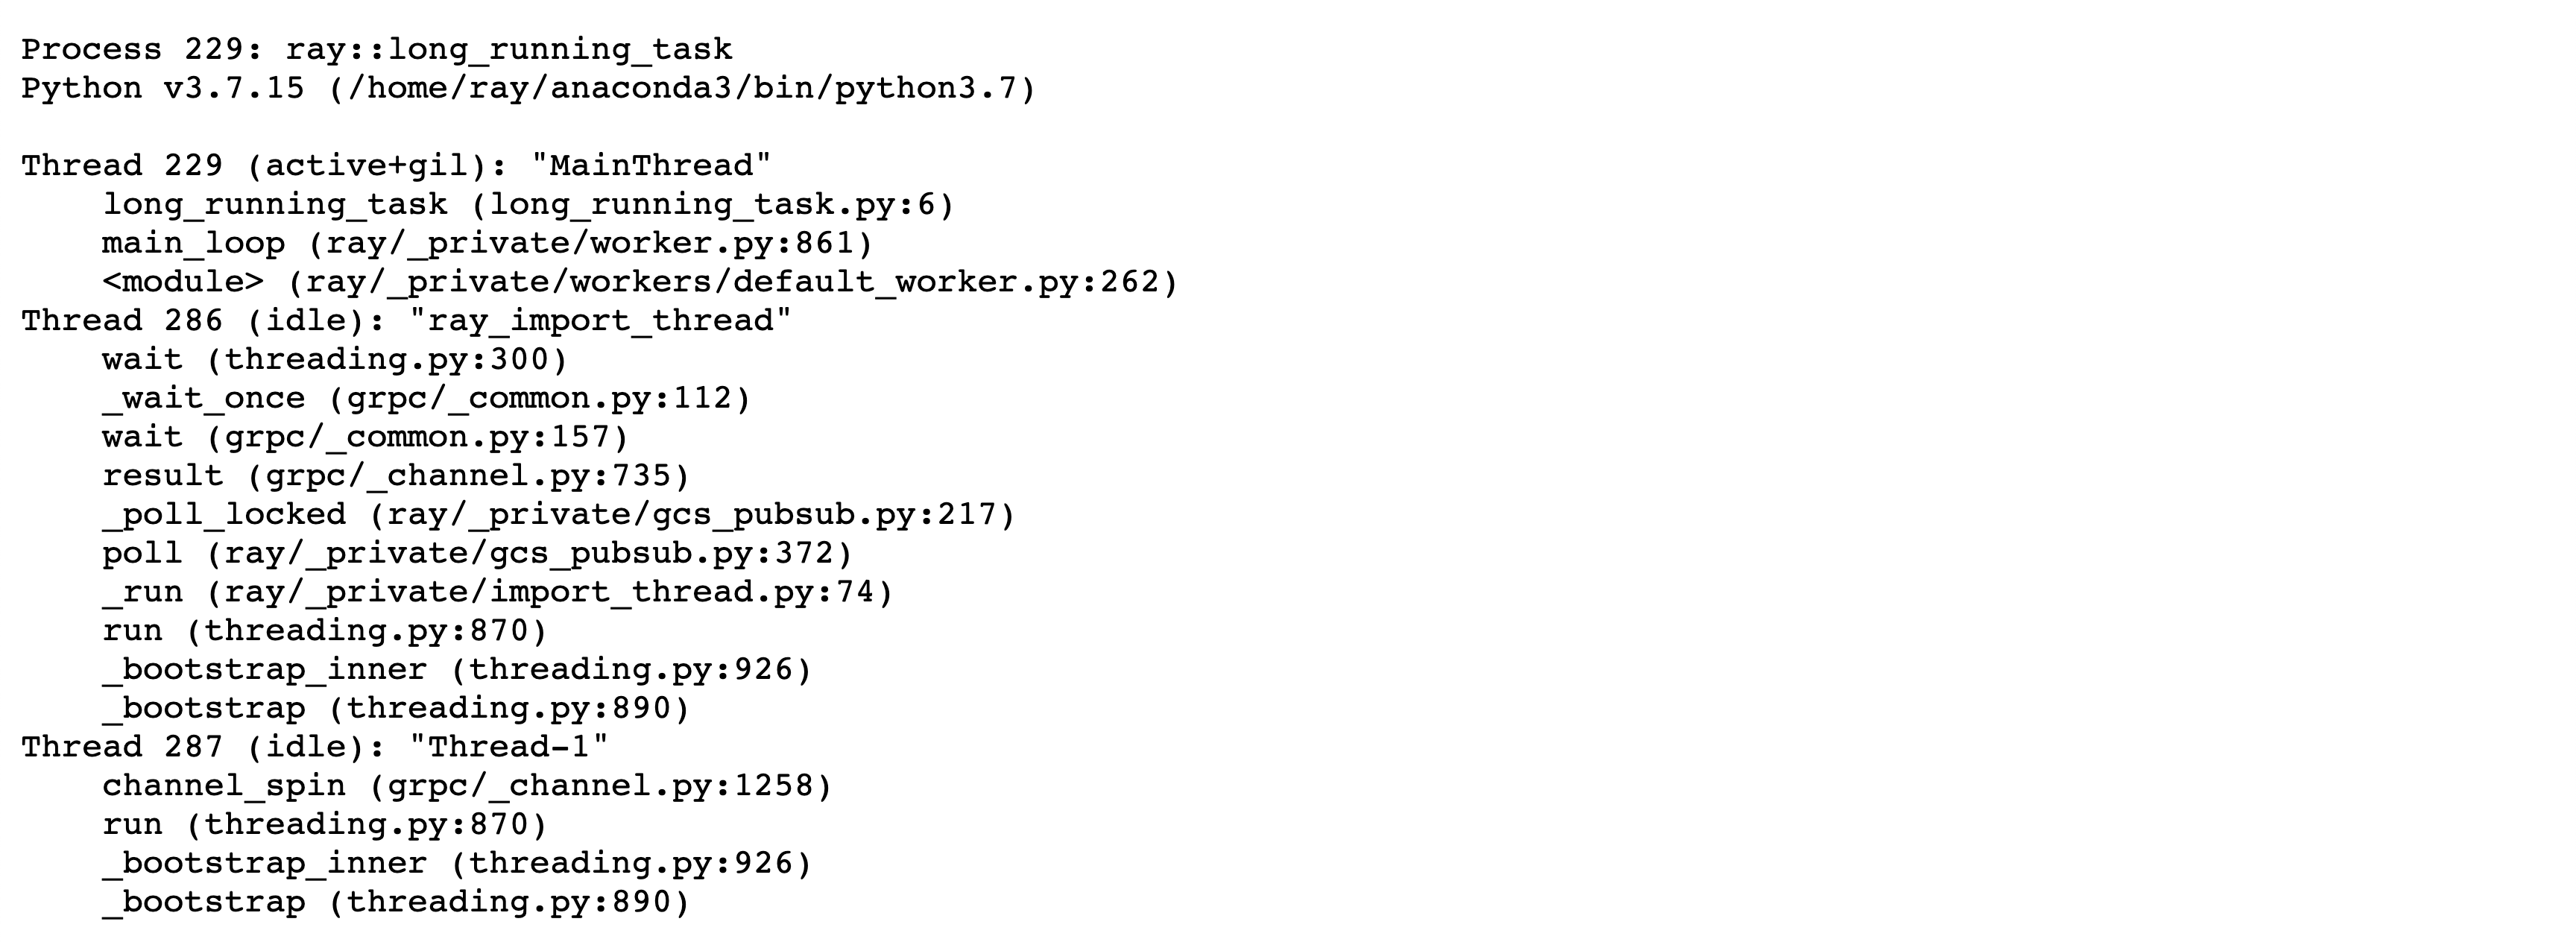
点击
CPU Flame Graph查看ray::long_running_task的 CPU 火焰图。
有关使用性能分析器的更多详细信息,请参阅 Dashboard 中的 Python CPU 性能分析。
步骤 7:清理#
kubectl delete -f https://raw.githubusercontent.com/ray-project/kuberay/master/ray-operator/config/samples/ray-cluster.py-spy.yaml
helm uninstall kuberay-operator