调试内存问题#
调试内存不足#
在阅读本节之前,请熟悉 Ray 的内存管理模型。
如果您的集群出现内存不足问题,请查看如何检测内存不足错误。
要定位内存泄漏的源头,请查看查找每个任务和 Actor 的内存使用情况。
如果您的头节点内存使用率很高,请查看头节点内存不足错误。
如果您的内存使用率因高并行度而很高,请查看降低并行度。
如果要分析每个任务和 Actor 的内存使用情况,请查看分析任务和 Actor 的内存使用情况。
什么是内存不足错误?#
内存是有限资源。当一个进程请求内存而操作系统无法分配时,操作系统会执行一个例程,通过杀死一个内存使用率高的进程(通过 SIGKILL)来释放内存,以避免操作系统变得不稳定。这个例程被称为Linux 内存不足杀手。
Linux 内存不足杀手的一个常见问题是 SIGKILL 会杀死进程,而 Ray 无法感知。由于 SIGKILL 不能被进程处理,Ray 很难生成适当的错误消息并采取适当的容错措施。为了解决这个问题,Ray 从 Ray 2.2 开始有了一个应用级的内存监视器,它持续监视主机的内存使用情况,并在 Linux 内存不足杀手执行之前杀死 Ray Worker。
检测内存不足错误#
如果 Linux 内存不足杀手终止了任务或 Actor,Ray Worker 进程无法捕获并显示确切的根本原因,因为 SIGKILL 不能被进程处理。如果您对已死亡 Worker 执行的任务和 Actor 调用ray.get,它会引发一个异常,并带有以下错误消息之一(表示 Worker 被意外杀死)。
Worker exit type: UNEXPECTED_SY STEM_EXIT Worker exit detail: Worker unexpectedly exits with a connection error code 2. End of file. There are some potential root causes. (1) The process is killed by SIGKILL by OOM killer due to high memory usage. (2) ray stop --force is called. (3) The worker is crashed unexpectedly due to SIGSEGV or other unexpected errors.
Worker exit type: SYSTEM_ERROR Worker exit detail: The leased worker has unrecoverable failure. Worker is requested to be destroyed when it is returned.
您还可以使用 dmesg CLI 命令来验证进程是否被 Linux 内存不足杀手杀死。

如果 Ray 的内存监视器杀死了 Worker,它会自动重试(详细信息请参阅链接)。如果任务或 Actor 无法重试,当您对其调用ray.get时,它们会引发一个带有更清晰错误消息的异常。
ray.exceptions.OutOfMemoryError: Task was killed due to the node running low on memory.

Task was killed due to the node running low on memory.
Memory on the node (IP: 10.0.62.231, ID: e5d953ef03e55e26f13973ea1b5a0fd0ecc729cd820bc89e4aa50451) where the task (task ID: 43534ce9375fa8e4cd0d0ec285d9974a6a95897401000000, name=allocate_memory, pid=11362, memory used=1.25GB) was running was 27.71GB / 28.80GB (0.962273), which exceeds the memory usage threshold of 0.95. Ray killed this worker (ID: 6f2ec5c8b0d5f5a66572859faf192d36743536c2e9702ea58084b037) because it was the most recently scheduled task; to see more information about memory usage on this node, use `ray logs raylet.out -ip 10.0.62.231`. To see the logs of the worker, use `ray logs worker-6f2ec5c8b0d5f5a66572859faf192d36743536c2e9702ea58084b037*out -ip 10.0.62.231.`
Top 10 memory users:
PID   MEM(GB) COMMAND
410728        8.47    510953  7.19    ray::allocate_memory
610952        6.15    ray::allocate_memory
711164        3.63    ray::allocate_memory
811156        3.63    ray::allocate_memory
911362        1.25    ray::allocate_memory
107230        0.09    python test.py --num-tasks 2011327      0.08    /home/ray/anaconda3/bin/python /home/ray/anaconda3/lib/python3.9/site-packages/ray/dashboard/dashboa...

Refer to the documentation on how to address the out of memory issue: https://docs.rayai.org.cn/en/latest/ray-core/scheduling/ray-oom-prevention.html.
Ray 内存监视器还会定期将聚合的内存不足杀手摘要打印到 Ray 驱动程序。
(raylet) [2023-04-09 07:23:59,445 E 395 395] (raylet) node_manager.cc:3049: 10 Workers (tasks / actors) killed due to memory pressure (OOM), 0 Workers crashed due to other reasons at node (ID: e5d953ef03e55e26f13973ea1b5a0fd0ecc729cd820bc89e4aa50451, IP: 10.0.62.231) over the last time period. To see more information about the Workers killed on this node, use `ray logs raylet.out -ip 10.0.62.231`
(raylet)
(raylet) Refer to the documentation on how to address the out of memory issue: https://docs.rayai.org.cn/en/latest/ray-core/scheduling/ray-oom-prevention.html. Consider provisioning more memory on this node or reducing task parallelism by requesting more CPUs per task. To adjust the kill threshold, set the environment variable `RAY_memory_usage_threshold` when starting Ray. To disable worker killing, set the environment variable `RAY_memory_monitor_refresh_ms` to zero.
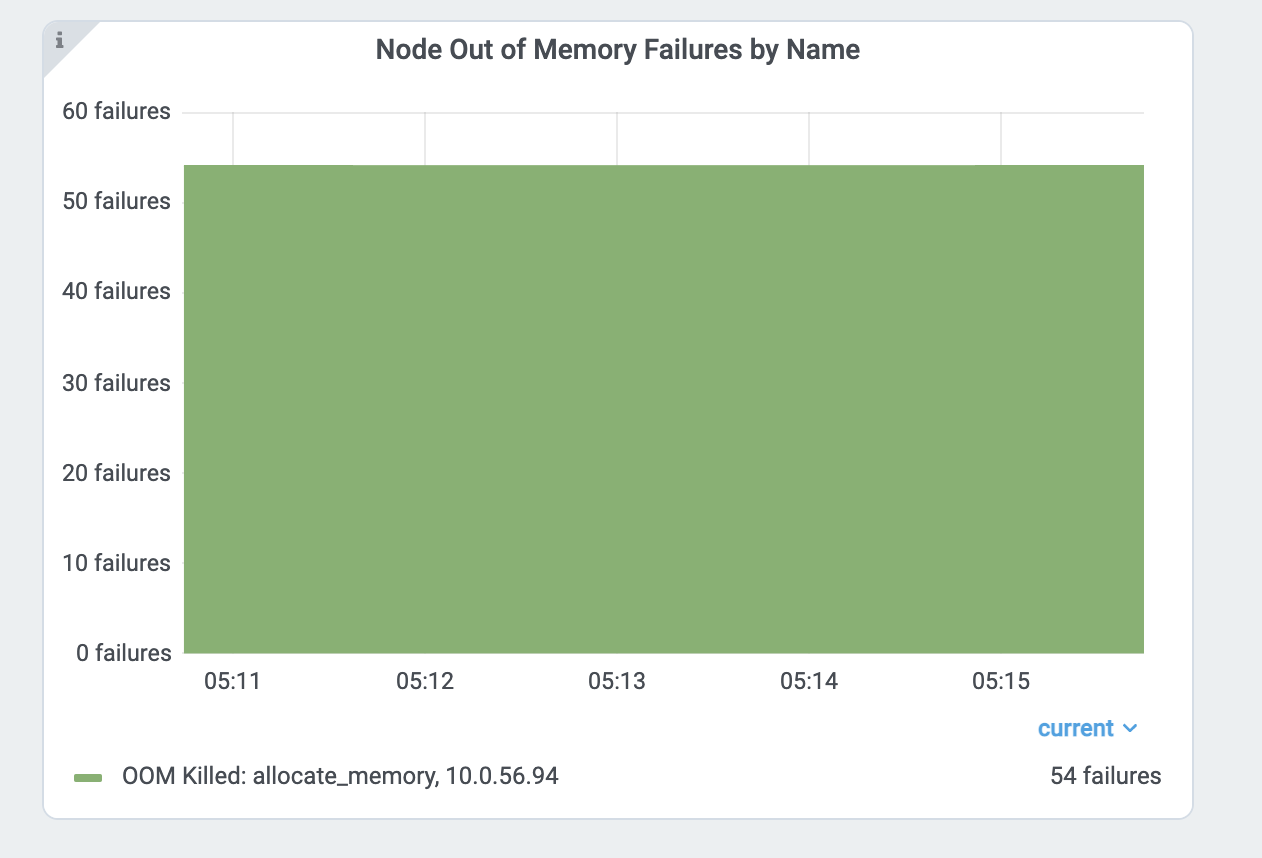
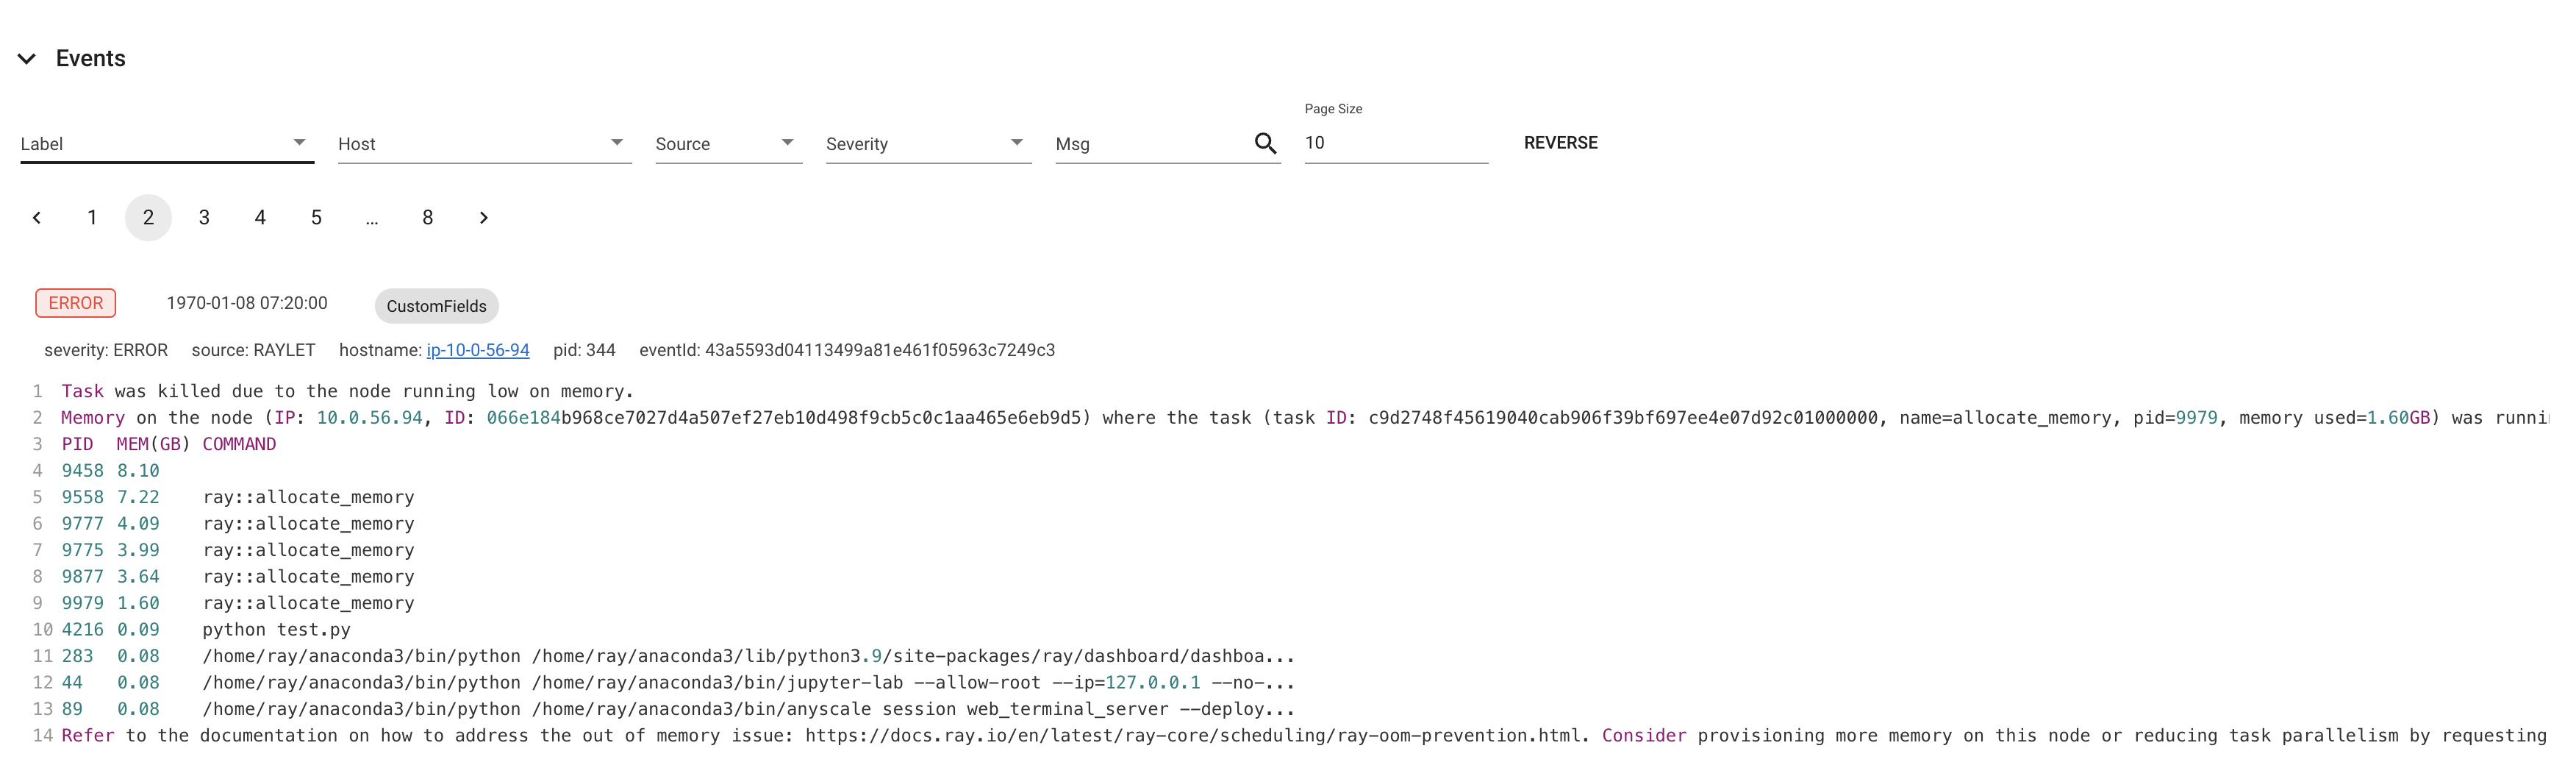
Ray Dashboard 的指标页面和事件页面也提供了内存不足杀手相关的事件和指标。
查找每个任务和 Actor 的内存使用情况#
如果任务或 Actor 因内存不足错误而失败,它们会根据重试策略进行重试。然而,通常最好是找到内存问题的根本原因并加以修复,而不是依赖容错机制。本节解释了如何在 Ray 中调试内存不足错误。
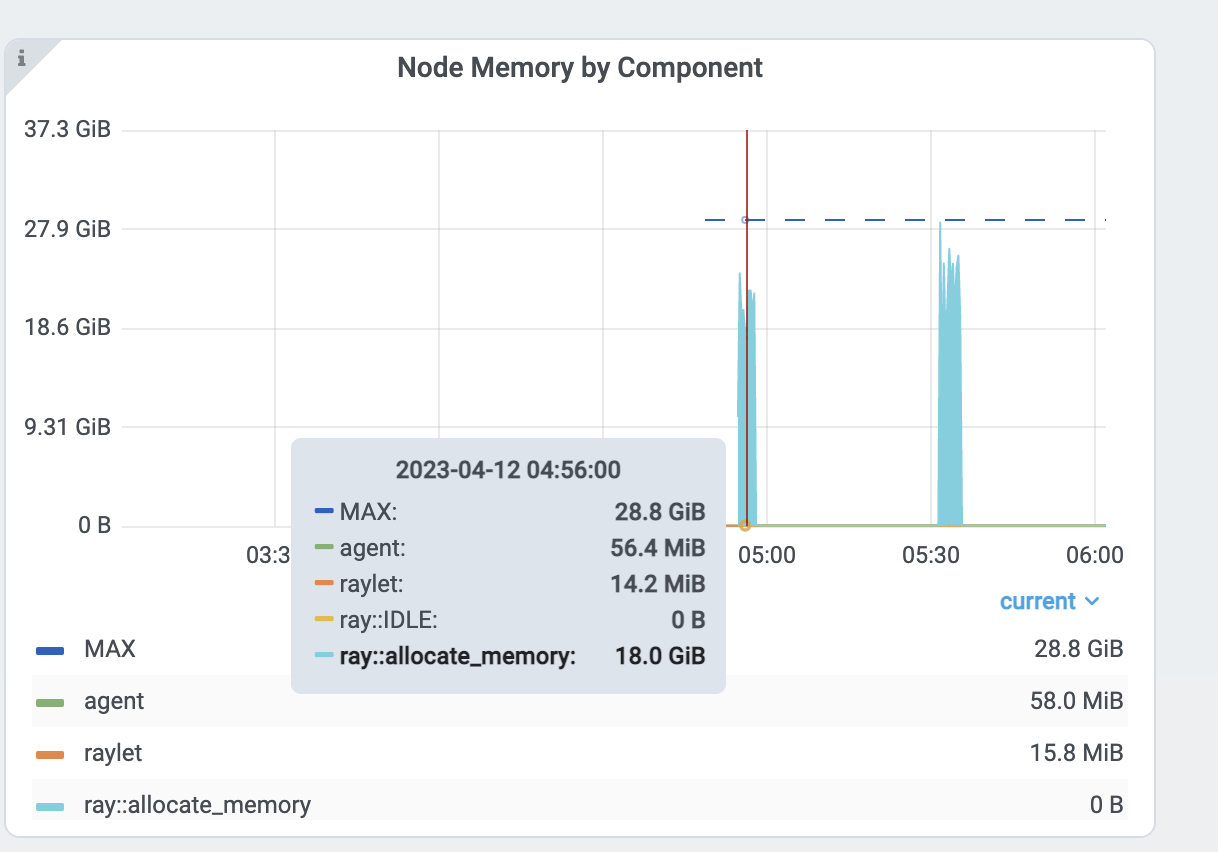
首先,找到内存使用率较高的任务和 Actor。查看每个任务和 Actor 的内存使用图表了解更多详情。每个组件图表中的内存使用量是 RSS - SHR。原因见下文。
或者,您也可以使用 CLI 命令 htop。
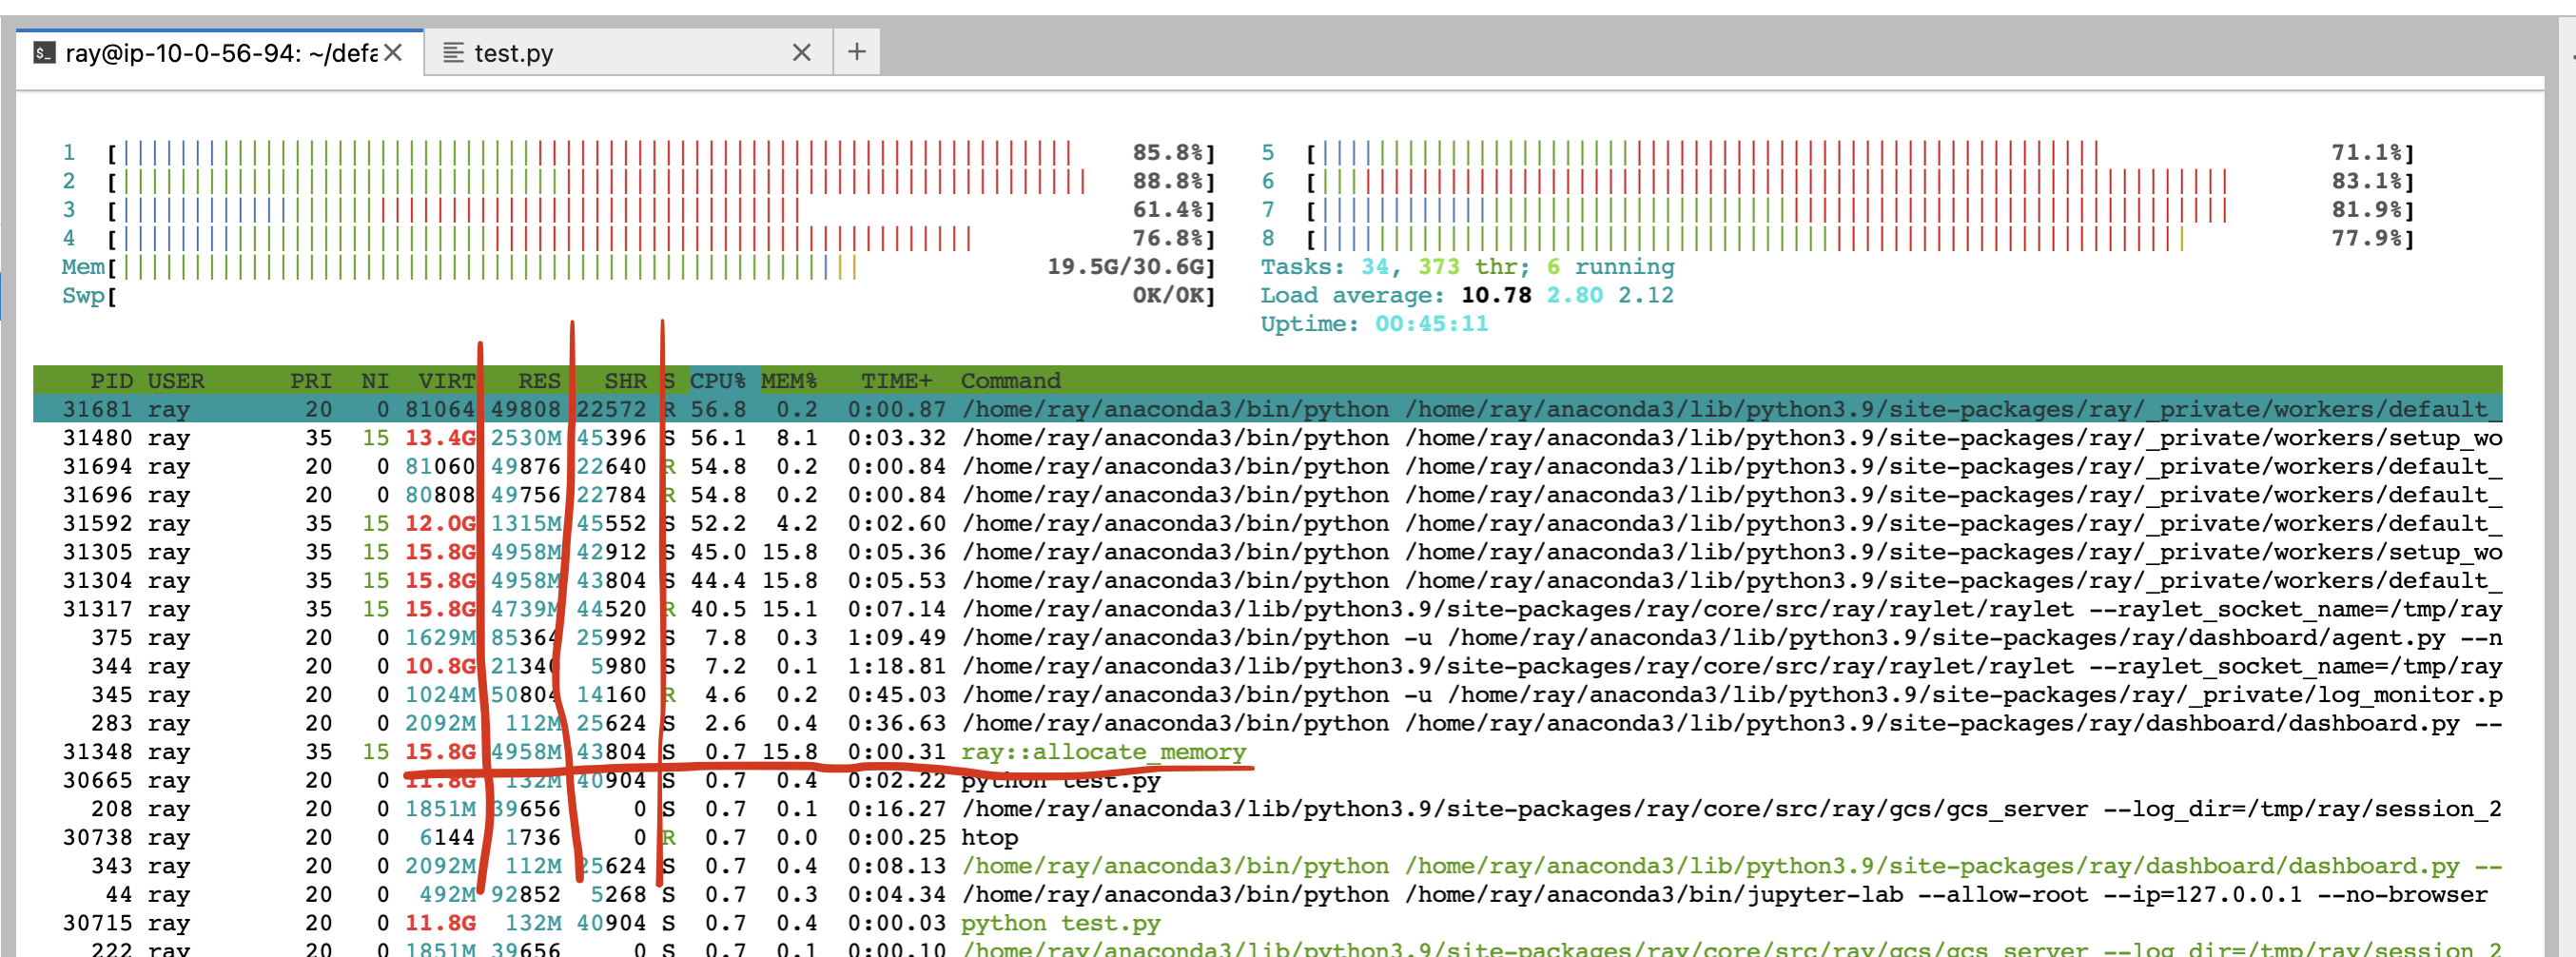
查看allocate_memory行。查看两列:RSS 和 SHR。
SHR 使用量通常是 Ray 对象存储的内存使用量。Ray 对象存储将 30% 的主机内存分配给共享内存(/dev/shm,除非您指定--object-store-memory)。如果 Ray Worker 使用ray.get访问对象存储中的对象,SHR 使用量会增加。由于 Ray 对象存储支持零拷贝反序列化,多个 Worker 可以访问同一个对象,而无需将其复制到进程内内存。例如,如果 8 个 Worker 访问 Ray 对象存储中的同一个对象,每个进程的SHR使用量会增加。然而,它们并没有使用 8 * SHR 的内存(共享内存中只有一份拷贝)。另外请注意,当对象使用量超出限制时,Ray 对象存储会触发对象溢出,这意味着共享内存的内存使用量不会超过主机内存的 30%。
主机的内存不足问题是由于每个 worker 的 RSS 使用量造成的。通过 RSS - SHR 计算每个进程的内存使用量,因为正如上面解释的,SHR 是用于 Ray 对象存储的。总内存使用量通常是 SHR (对象存储内存使用量,内存的 30%) + sum(每个 ray 进程的 RSS - SHR) + sum(系统组件的 RSS - SHR。例如,raylet,GCS。通常很小)。
头节点内存不足错误#
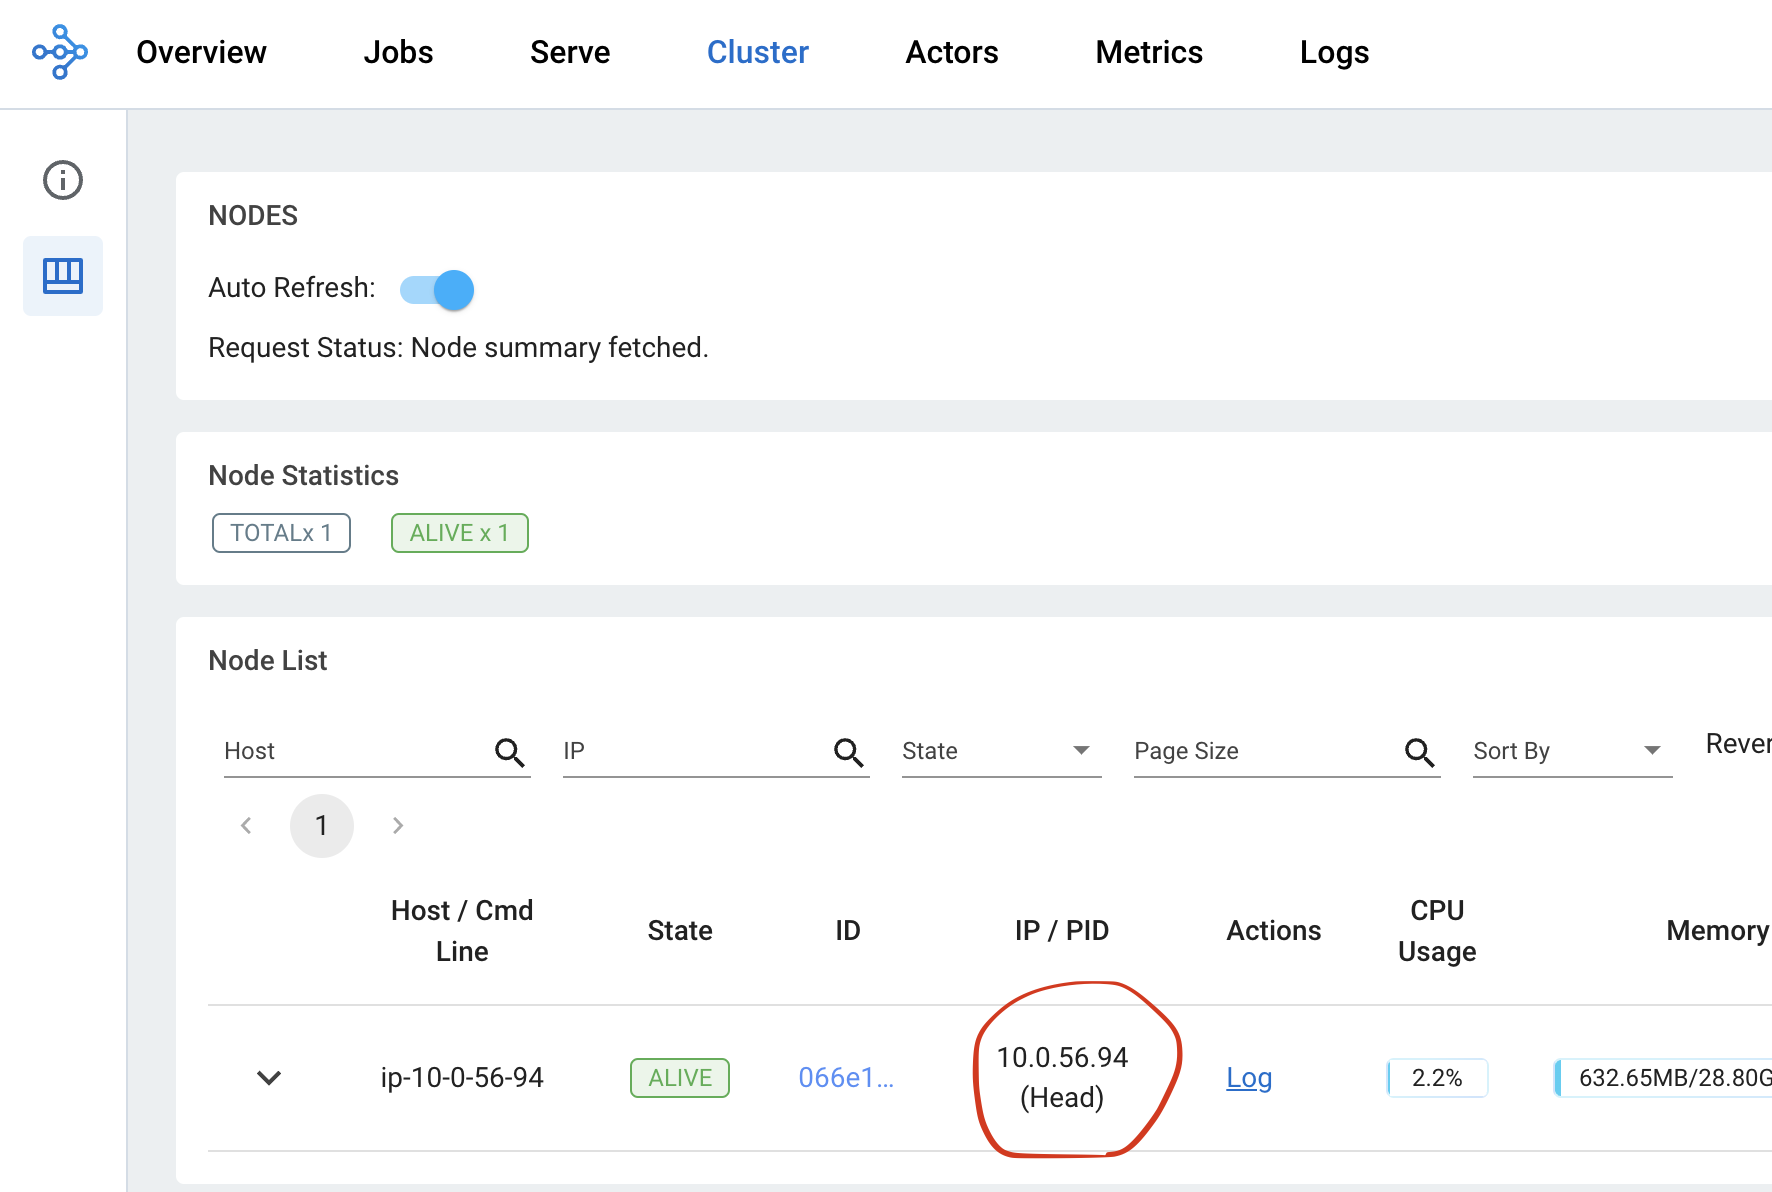
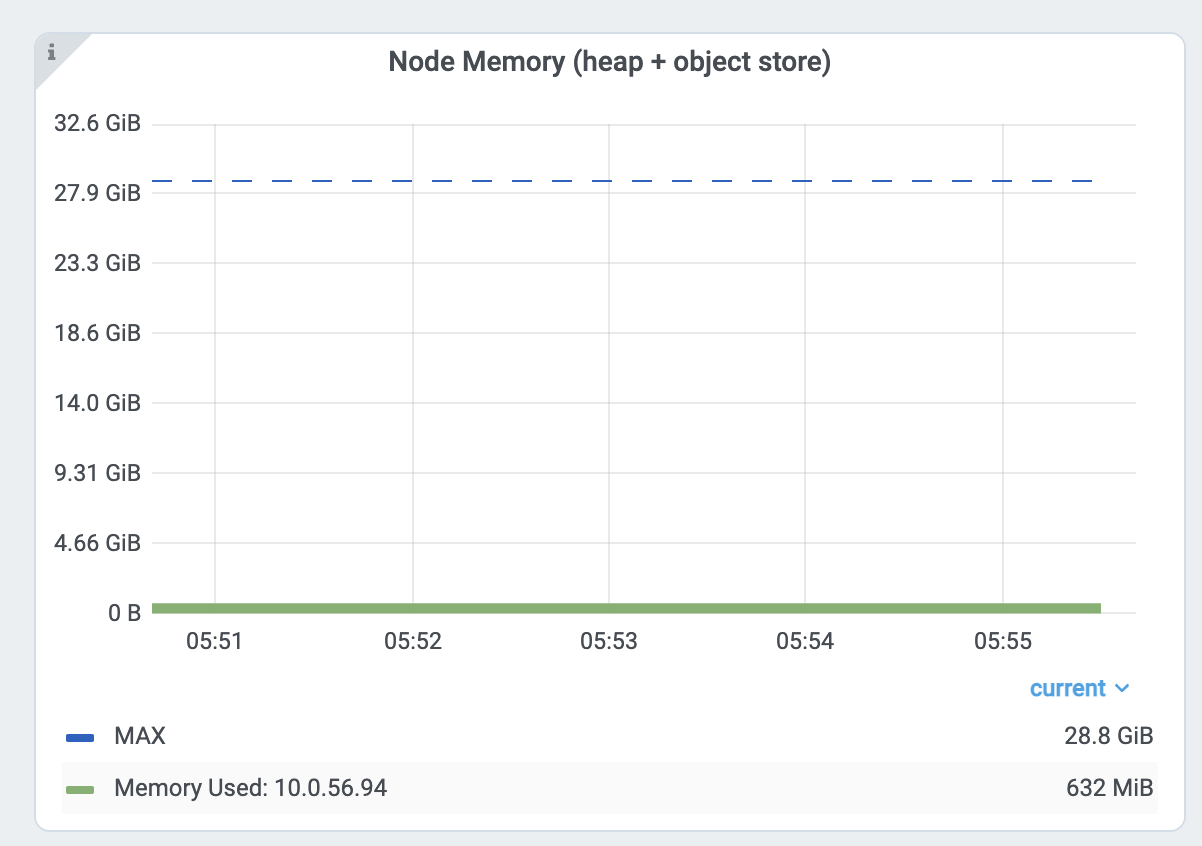
首先,在指标页面检查头节点的内存使用情况。从集群页面找到头节点的地址。
然后在 Dashboard 的指标视图中,从节点内存使用视图检查头节点的内存使用情况。
Ray 头节点有更多内存密集型的系统组件,例如 GCS 或 dashboard。此外,驱动程序默认在头节点上运行。如果头节点与 Worker 节点具有相同的内存容量,并且您在头节点上执行与 Worker 节点相同数量的任务和 Actor,则很容易出现内存不足问题。在这种情况下,启动头节点时使用ray start --head并指定--num-cpus=0,不要在头节点上运行任何任务和 Actor。如果您使用 KubeRay,请查看这里 <kuberay-num-cpus>。
降低并行度#
高并行度可能触发内存不足错误。例如,如果您有 8 个训练 Worker 执行数据预处理 -> 训练。如果您向每个 Worker 加载过多的数据,则总内存使用量(训练 worker 内存使用量 * 8)可能会超过内存容量。
通过查看每个任务和 Actor 的内存使用图表以及任务指标来验证内存使用情况。
首先,查看allocate_memory任务的内存使用情况。总共是 18GB。同时,验证正在运行的 15 个并发任务。
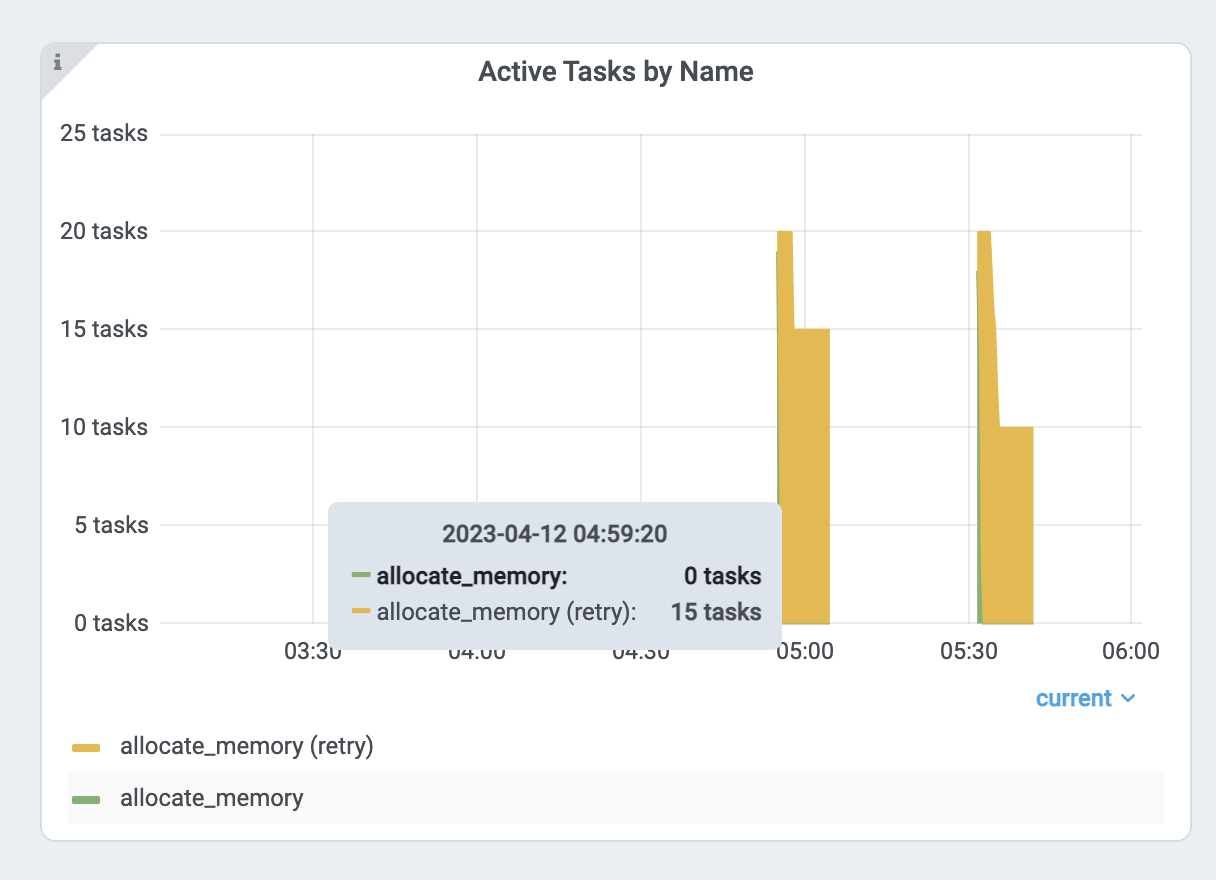
每个任务使用约 18GB / 15 == 1.2 GB。为了降低并行度
增加
ray.remote()的num_cpus选项。现代硬件通常每个 CPU 有 4GB 内存,因此您可以相应地选择 CPU 要求。此示例为每个allocate_memory任务指定 1 个 CPU。将 CPU 要求加倍,同时只运行一半(7 个)任务,内存使用量不会超过 9GB。
分析任务和 Actor 的内存使用情况#
任务和 Actor 也可能使用比您预期更多的内存。例如,actor 或任务可能存在内存泄漏或不必要的拷贝。
查看下面的说明,了解如何对单个 actor 和任务进行内存分析。
Ray 任务和 Actor 的内存分析#
要对 Ray 任务或 actor 进行内存分析,请使用 memray。请注意,如果其他内存分析工具支持类似的 API,您也可以使用它们。
首先,安装memray。
pip install memray
memray支持 Python 上下文管理器以启用内存分析。您可以将memray分析文件写入任何您想要的位置。但在本示例中,我们将把它们写入/tmp/ray/session_latest/logs,因为 Ray dashboard 允许您下载日志文件夹中的文件。这将使您可以从其他节点下载分析文件。
import memray
import ray


@ray.remote
class Actor:
    def __init__(self):
        # Every memory allocation after `__enter__` method will be tracked.
        memray.Tracker(
            "/tmp/ray/session_latest/logs/"
            f"{ray.get_runtime_context().get_actor_id()}_mem_profile.bin"
        ).__enter__()
        self.arr = [bytearray(b"1" * 1000000)]

    def append(self):
        self.arr.append(bytearray(b"1" * 1000000))


a = Actor.remote()
ray.get(a.append.remote())
请注意,任务的生命周期较短,因此可能会有很多内存分析文件。
import memray  # noqa
import ray  # noqa


@ray.remote
def task():
    with memray.Tracker(
        "/tmp/ray/session_latest/logs/"
        f"{ray.get_runtime_context().get_task_id()}_mem_profile.bin"
    ):
        arr = bytearray(b"1" * 1000000)  # noqa


ray.get(task.remote())
任务或 actor 运行后,转到 dashboard 的日志视图。找到并点击日志文件名。
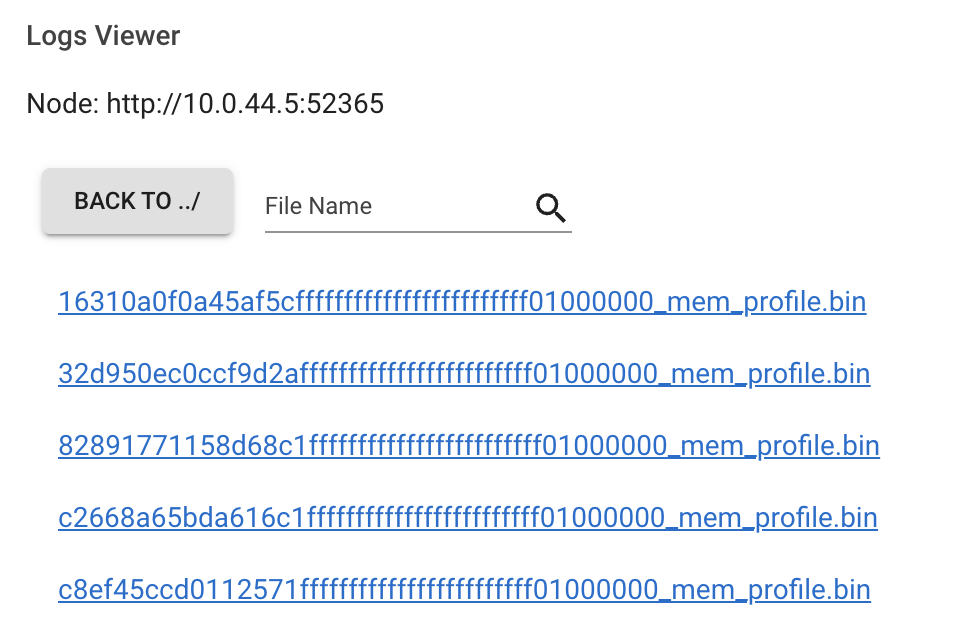
点击下载按钮。
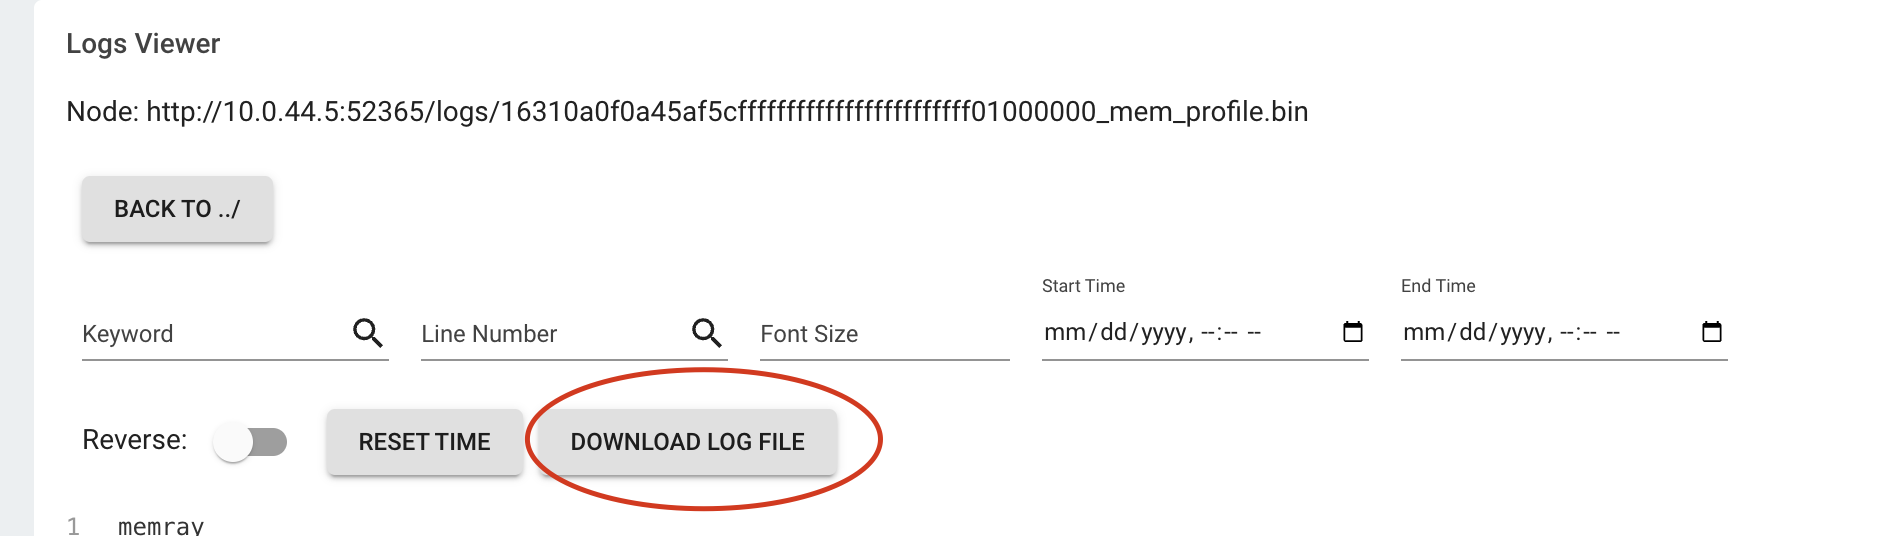
现在,您有了内存分析文件。运行
memray flamegraph <memory profiling bin file>
然后您就可以看到内存分析的结果了!