持久化 KubeRay Operator 日志#
KubeRay Operator 在管理 Kubernetes 上的 Ray 集群方面起着至关重要的作用。持久化其日志对于有效的故障排除和监控至关重要。本指南介绍了为 KubeRay Operator 日志设置集中式日志记录的方法。
Grafana Loki#
Grafana Loki 是一个针对 Kubernetes 优化的日志聚合系统,提供了高效的日志存储和查询功能。以下步骤将 Fluent Bit 设置为 DaemonSet,用于收集 Kubernetes 容器的日志并将其发送到 Loki 进行集中存储和分析。
部署 Loki 单体模式#
Loki 的 Helm Chart 支持三种部署方法,以适应不同的可扩展性和性能需求:单体模式(Monolithic)、简单可扩展模式(Simple Scalable)和微服务模式(Microservices)。本指南演示了单体模式。有关每种部署模式的详细信息,请参阅 Loki 部署模式文档。
使用 Helm Chart 仓库部署 Loki。
helm repo add grafana https://grafana.github.io/helm-charts
helm repo update

# Install Loki with single replica mode
helm install loki grafana/loki --version 6.21.0 -f https://raw.githubusercontent.com/grafana/loki/refs/heads/main/production/helm/loki/single-binary-values.yaml
配置日志处理#
创建一个 fluent-bit-config.yaml 文件,配置 Fluent Bit 以便
跟踪(Tail)Kubernetes 容器的日志文件。
解析 Docker 和容器运行时接口 (CRI) 格式的多行日志。
使用 Kubernetes 元数据(如命名空间、Pod 和容器名称)丰富日志。
将日志发送到 Loki 进行集中存储和查询。
config:
  inputs: |
    [INPUT]
        Name tail
        Path /var/log/containers/*.log
        multiline.parser docker, cri
        Tag kube.*
        Mem_Buf_Limit 5MB
        Skip_Long_Lines On

  filters: |
    [FILTER]
        Name kubernetes
        Match kube.*
        Merge_Log On
        Keep_Log Off
        K8S-Logging.Parser On
        K8S-Logging.Exclude On

  outputs: |
    [OUTPUT]
        Name loki
        Match *
        Host loki-gateway
        Port 80
        Labels job=fluent-bit,namespace=$kubernetes['namespace_name'],pod=$kubernetes['pod_name'],container=$kubernetes['container_name']
        Auto_Kubernetes_Labels Off
        tenant_id test
关于上述配置的一些说明
输入 (Inputs):
tail输入从/var/log/containers/*.log读取日志文件,使用multiline.parser处理跨越多行的复杂日志消息。过滤器 (Filters):
kubernetes过滤器为每条日志添加命名空间、Pod 和容器名称等元数据,从而在 Loki 中实现更高效的日志管理和查询。输出 (Outputs):
loki输出块指定 Loki 作为目标。Host和Port定义了 Loki 服务端点,而Labels添加元数据以便在 Grafana 中更轻松地查询。此外,如果 Loki 设置需要,tenant_id允许进行多租户配置。
使用 Helm Chart 仓库部署 Fluent Bit。
helm repo add fluent https://fluent.github.io/helm-charts
helm repo update

helm install fluent-bit fluent/fluent-bit --version 0.48.2 -f fluent-bit-config.yaml
安装 KubeRay Operator#
按照部署 KubeRay Operator 来安装 KubeRay Operator。
部署 RayCluster#
按照部署 RayCluster 自定义资源 来部署 RayCluster。
部署 Grafana#
创建一个 datasource-config.yaml 文件,包含以下配置,用于设置 Grafana 的 Loki 数据源
datasources:
  datasources.yaml:
    apiVersion: 1
    datasources:
      - name: Loki
        type: loki
        access: proxy
        editable: true
        url: http://loki-gateway.default
        jsonData:
          timeout: 60
          maxLines: 1000
          httpHeaderName1: "X-Scope-OrgID"
        secureJsonData:
          httpHeaderValue1: "test"
使用 Helm Chart 仓库部署 Grafana。
helm repo add grafana https://grafana.github.io/helm-charts
helm repo update

helm install grafana grafana/grafana --version 8.6.2 -f datasource-config.yaml
检查 Grafana Dashboard#
# Verify that the Grafana pod is running in the `default` namespace.
kubectl get pods --namespace default -l "app.kubernetes.io/name=grafana"
# NAME                       READY   STATUS    RESTARTS   AGE
# grafana-54d5d747fd-5fldc   1/1     Running   0          8m21s
要从本地机器访问 Grafana,请通过运行以下命令设置端口转发
export POD_NAME=$(kubectl get pods --namespace default -l "app.kubernetes.io/name=grafana,app.kubernetes.io/instance=grafana" -o jsonpath="{.items[0].metadata.name}")
kubectl --namespace default port-forward $POD_NAME 3000
此命令将使 Grafana 在本地的 https://:3000 可用。
用户名:“admin”
密码:使用以下命令获取密码
kubectl get secret --namespace default grafana -o jsonpath="{.data.admin-password}" | base64 --decode ; echo
最后,使用 LogQL 查询来查看特定 Pod(例如 KubeRay Operator)的日志,并按 RayCluster_name 过滤日志
{pod="kuberay-operator-xxxxxxxx-xxxxx"} | json | RayCluster_name = `raycluster-kuberay`
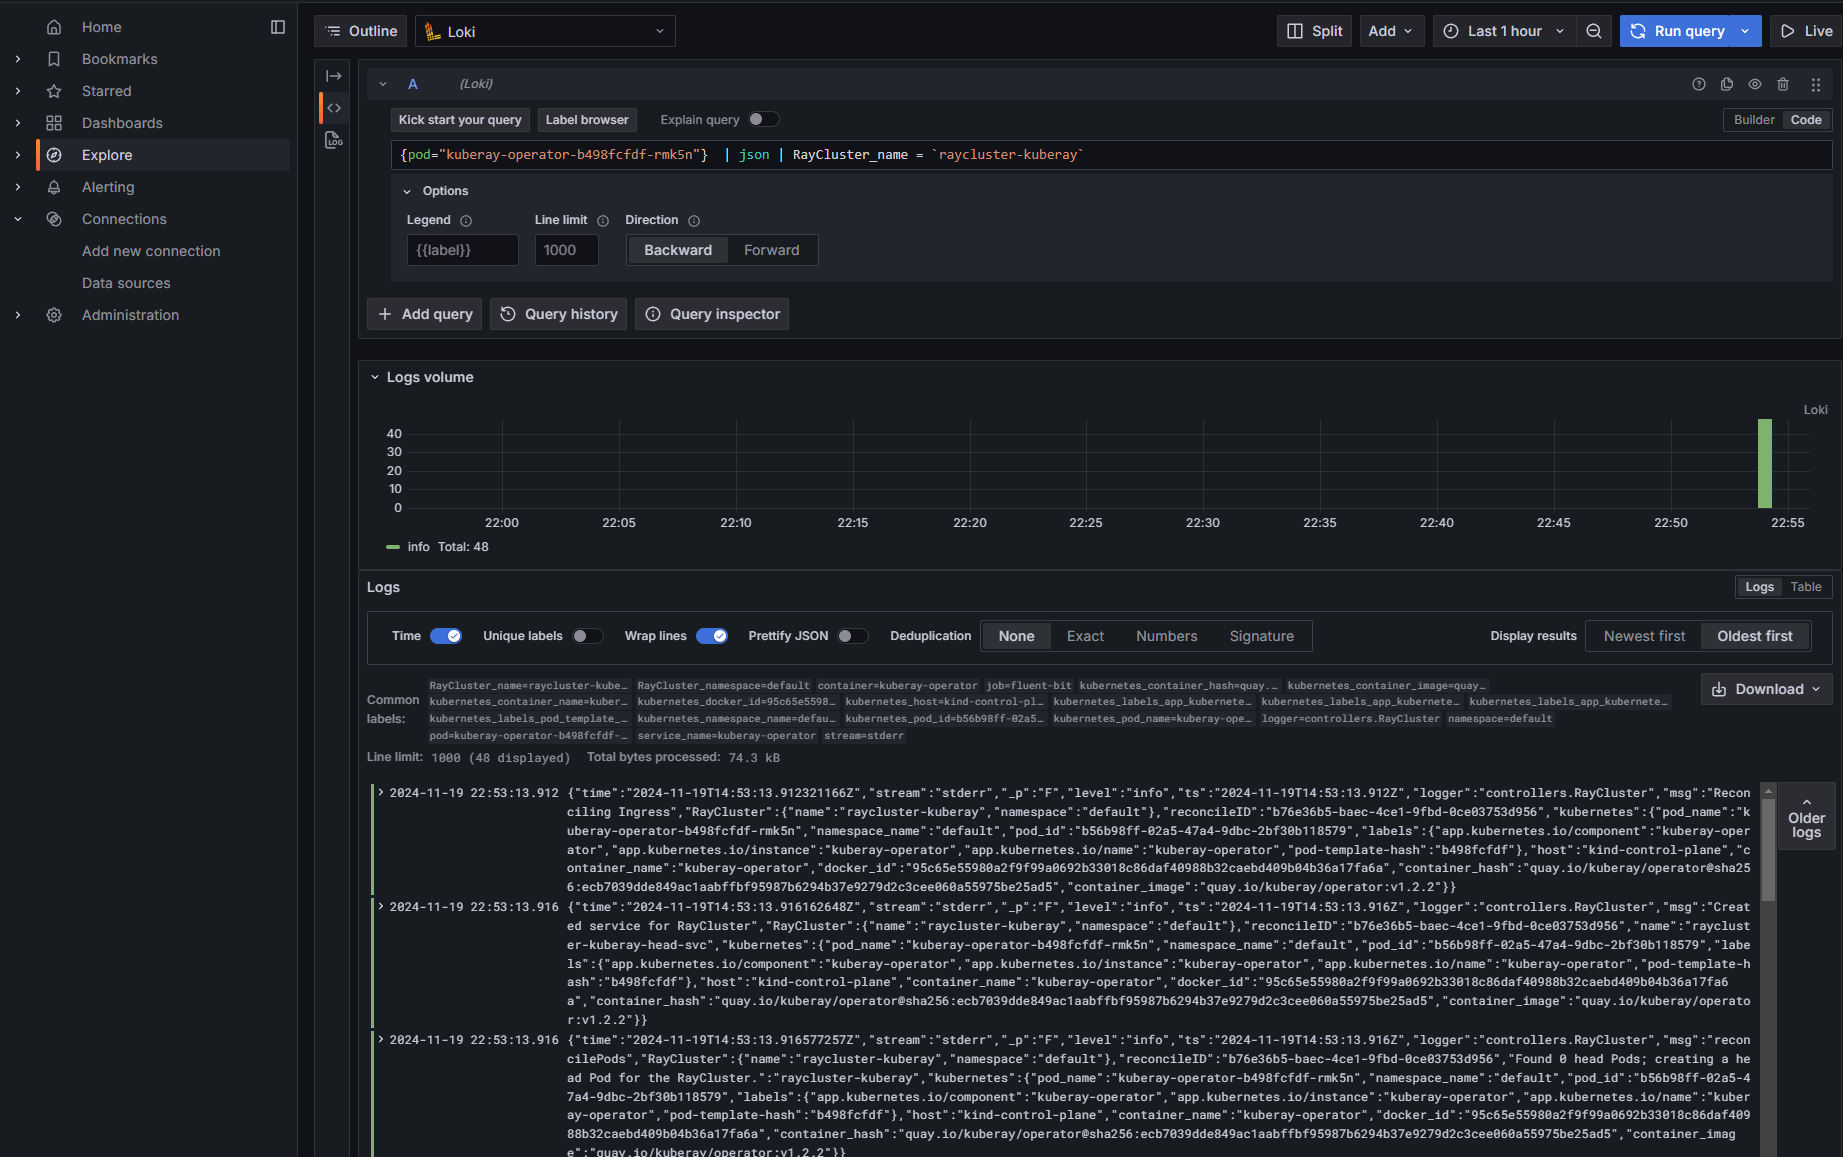
您可以使用 LogQL 的 JSON 语法基于特定字段(例如 RayCluster_name)过滤日志。有关 LogQL 过滤的更多信息,请参阅日志查询语言文档。