性能分析#
Ray Compiled Graph 提供了基于 PyTorch 和 Nsight 的性能分析功能,以更好地理解单个任务的性能、系统开销和性能瓶颈。您可以根据自己的喜好选择性能分析器。
PyTorch 性能分析器#
要在 Compiled Graph 上运行 PyTorch 性能分析,只需在运行脚本时设置环境变量 RAY_CGRAPH_ENABLE_TORCH_PROFILING=1。例如,对于位于 example.py 中的 Compiled Graph 脚本,运行以下命令
RAY_CGRAPH_ENABLE_TORCH_PROFILING=1 python3 example.py
执行后,Compiled Graph 会将性能分析结果生成在当前工作目录下的 compiled_graph_torch_profiles 目录中。Compiled Graph 为每个 Actor 生成一个跟踪文件。
您可以使用 https://ui.perfetto.dev/ 来可视化跟踪。
Nsight 系统性能分析器#
Compiled Graph 构建在 Ray 的性能分析能力之上,并利用了 Nsight 系统性能分析。
要在 Compiled Graph 上运行 Nsight 性能分析,请按照 在 Ray 上运行 Nsight 中所述,为涉及的 Actor 指定 runtime_env。例如,
import ray
import torch
from ray.dag import InputNode


@ray.remote(num_gpus=1, runtime_env={"nsight": "default"})
class RayActor:
    def send(self, shape, dtype, value: int):
        return torch.ones(shape, dtype=dtype, device="cuda") * value

    def recv(self, tensor):
        return (tensor[0].item(), tensor.shape, tensor.dtype)


sender = RayActor.remote()
receiver = RayActor.remote()
然后,照常创建 Compiled Graph。
shape = (10,)
dtype = torch.float16

# Test normal execution.
with InputNode() as inp:
    dag = sender.send.bind(inp.shape, inp.dtype, inp[0])
    dag = dag.with_tensor_transport(transport="nccl")
    dag = receiver.recv.bind(dag)

compiled_dag = dag.experimental_compile()

for i in range(3):
    shape = (10 * (i + 1),)
    ref = compiled_dag.execute(i, shape=shape, dtype=dtype)
    assert ray.get(ref) == (i, shape, dtype)
最后,照常运行脚本。
python3 example.py
执行后,Compiled Graph 会将性能分析结果生成在 /tmp/ray/session_*/logs/{profiler_name} 目录下。
对于方法调用和系统开销的细粒度性能分析,请在运行脚本时设置环境变量 RAY_CGRAPH_ENABLE_NVTX_PROFILING=1
RAY_CGRAPH_ENABLE_NVTX_PROFILING=1 python3 example.py
此命令在底层利用 NVTX 库,自动标注编译图执行循环中调用的所有方法。
要可视化性能分析结果,请按照 Nsight 性能分析结果 中所述的相同说明操作。
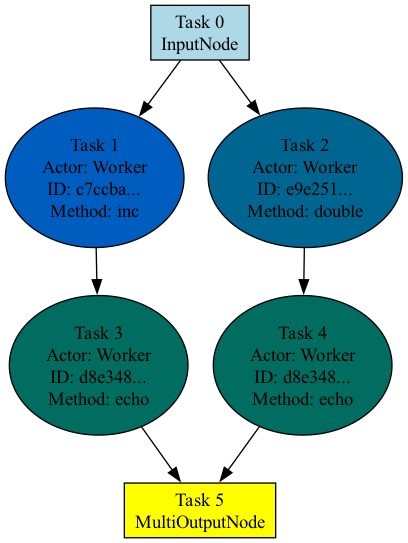
可视化#
要可视化图结构,请在调用 experimental_compile 后调用 visualize 方法。
import ray
from ray.dag import InputNode, MultiOutputNode


@ray.remote
class Worker:
    def inc(self, x):
        return x + 1

    def double(self, x):
        return x * 2

    def echo(self, x):
        return x


sender1 = Worker.remote()
sender2 = Worker.remote()
receiver = Worker.remote()

with InputNode() as inp:
    w1 = sender1.inc.bind(inp)
    w1 = receiver.echo.bind(w1)
    w2 = sender2.double.bind(inp)
    w2 = receiver.echo.bind(w2)
    dag = MultiOutputNode([w1, w2])

compiled_dag = dag.experimental_compile()
compiled_dag.visualize()
默认情况下,Ray 会生成一个名为 compiled_graph.png 的 PNG 图像,并将其保存在当前工作目录中。请注意,这需要安装 graphviz。
下图显示了前面代码的可视化结果。属于同一 Actor 的任务颜色相同。